Douglas L. Sondak1, Erik Brisson1 and Daniel J. Dorney2
1 Scientific Computing and Visualization, Boston University, Boston, MA, USA
2 NASA Marshall Space Flight Center, Huntsville, AL, USA
Introduction
The availability of large, fast computers has greatly increased the scale and complexity of scientific computation. The amount of data generated by these simulations has also grown, and deducing physical structures from the results can be a daunting task. Individuals in different physical locations often collaborate on largescale simulations, and the results are frequently of interest to other individuals who were not involved with the original computations. A distributed computing environment is an ideal venue to allow collaborators to participate in the interrogation of the results.
Interactive Particle Tracking
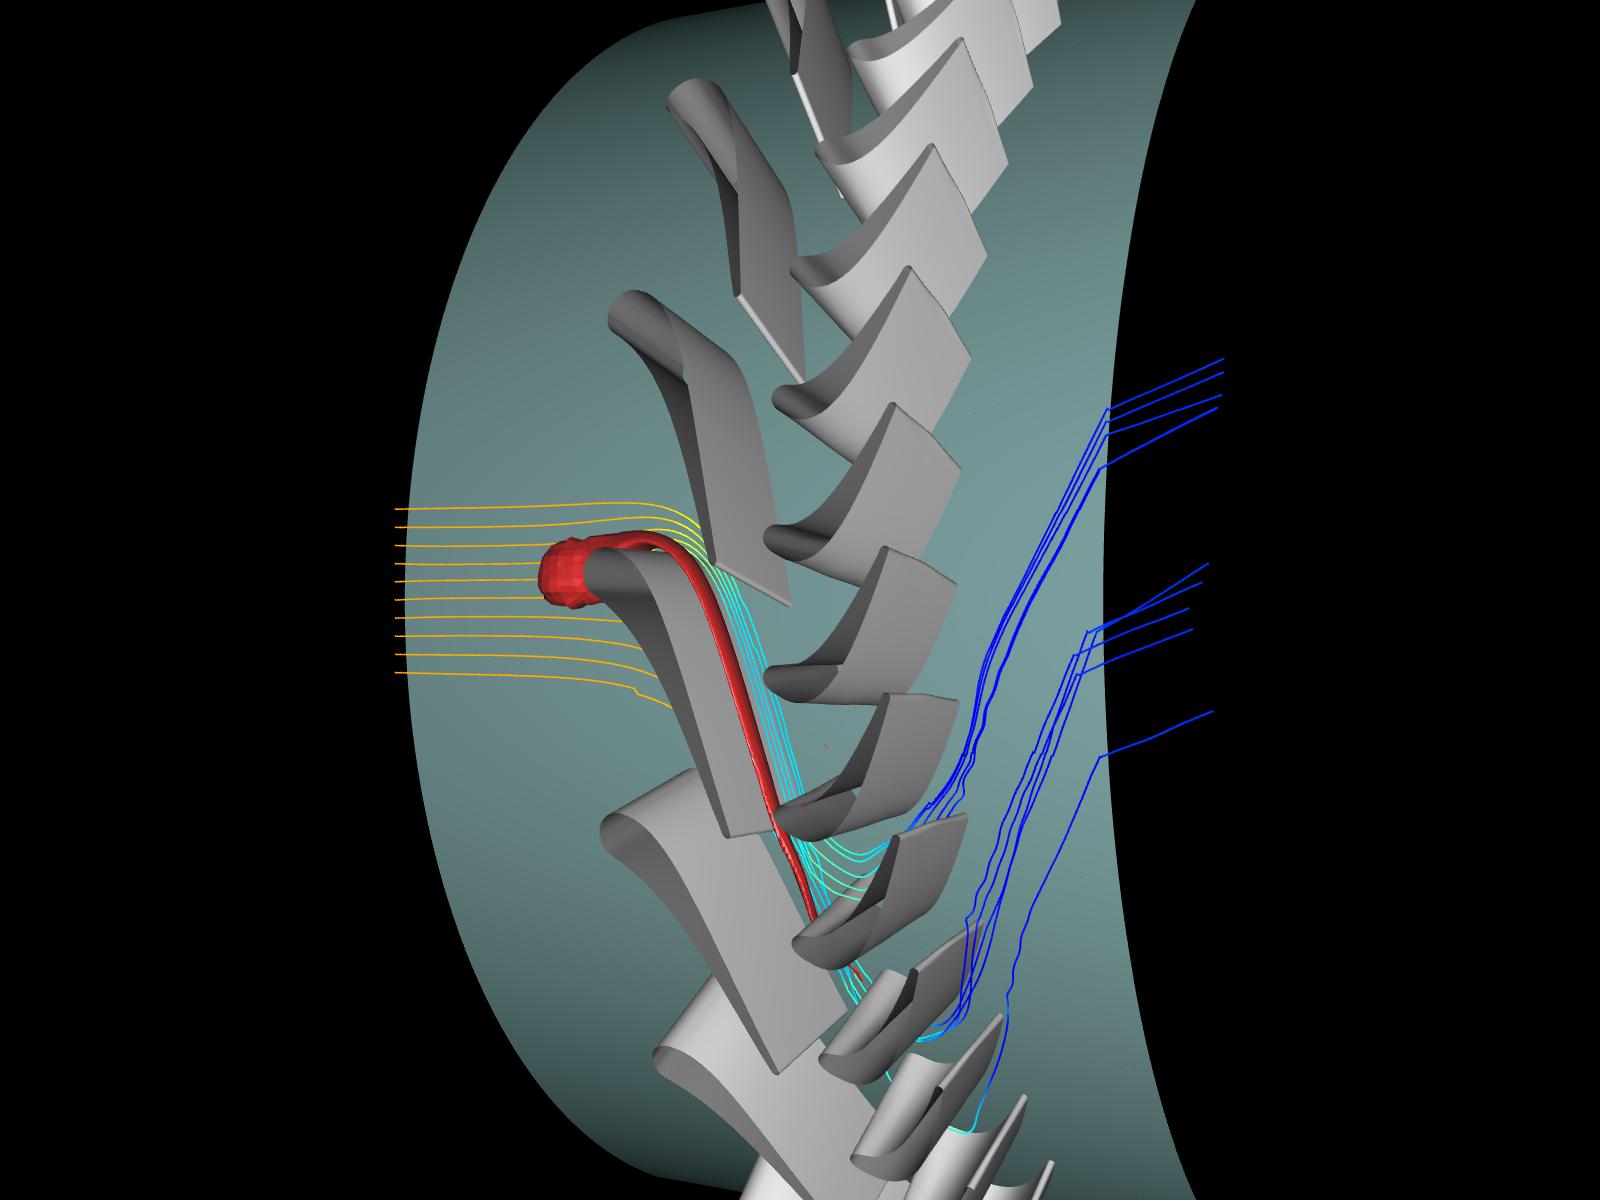
One technique for visualizing velocity fields is to render the path, or “streakline” of a particle released at a specified point. Important flow features such as separated flow regions and vortices are then readily apparent. The turbine flow demo allows a user to pick points anywhere within the simulation domain and see the resulting streaklines. This consists of a visualization component running on a graphics workstation and driving the Boston University Deep Vision Display Wall, a navigation/picking client running on a Windows PC, and a streakline generator program running on a highperformance parallel system.
The streakline generator initially reads in a precomputed solution completely defining the flow within the turbine. The user picks points within the computational domain displayed on the Wall, using a wireless Gyromouse. These points are sent to the streakline generation program, which integrates them over a sequence of time steps. For each time step, the current positions for all streaklines are sent back to the visualization application. This demo is built on top of SCV’s Distributed Applications Framework For Immersive Environments (DAFFIE) system.
Application to Turbine Flow Field
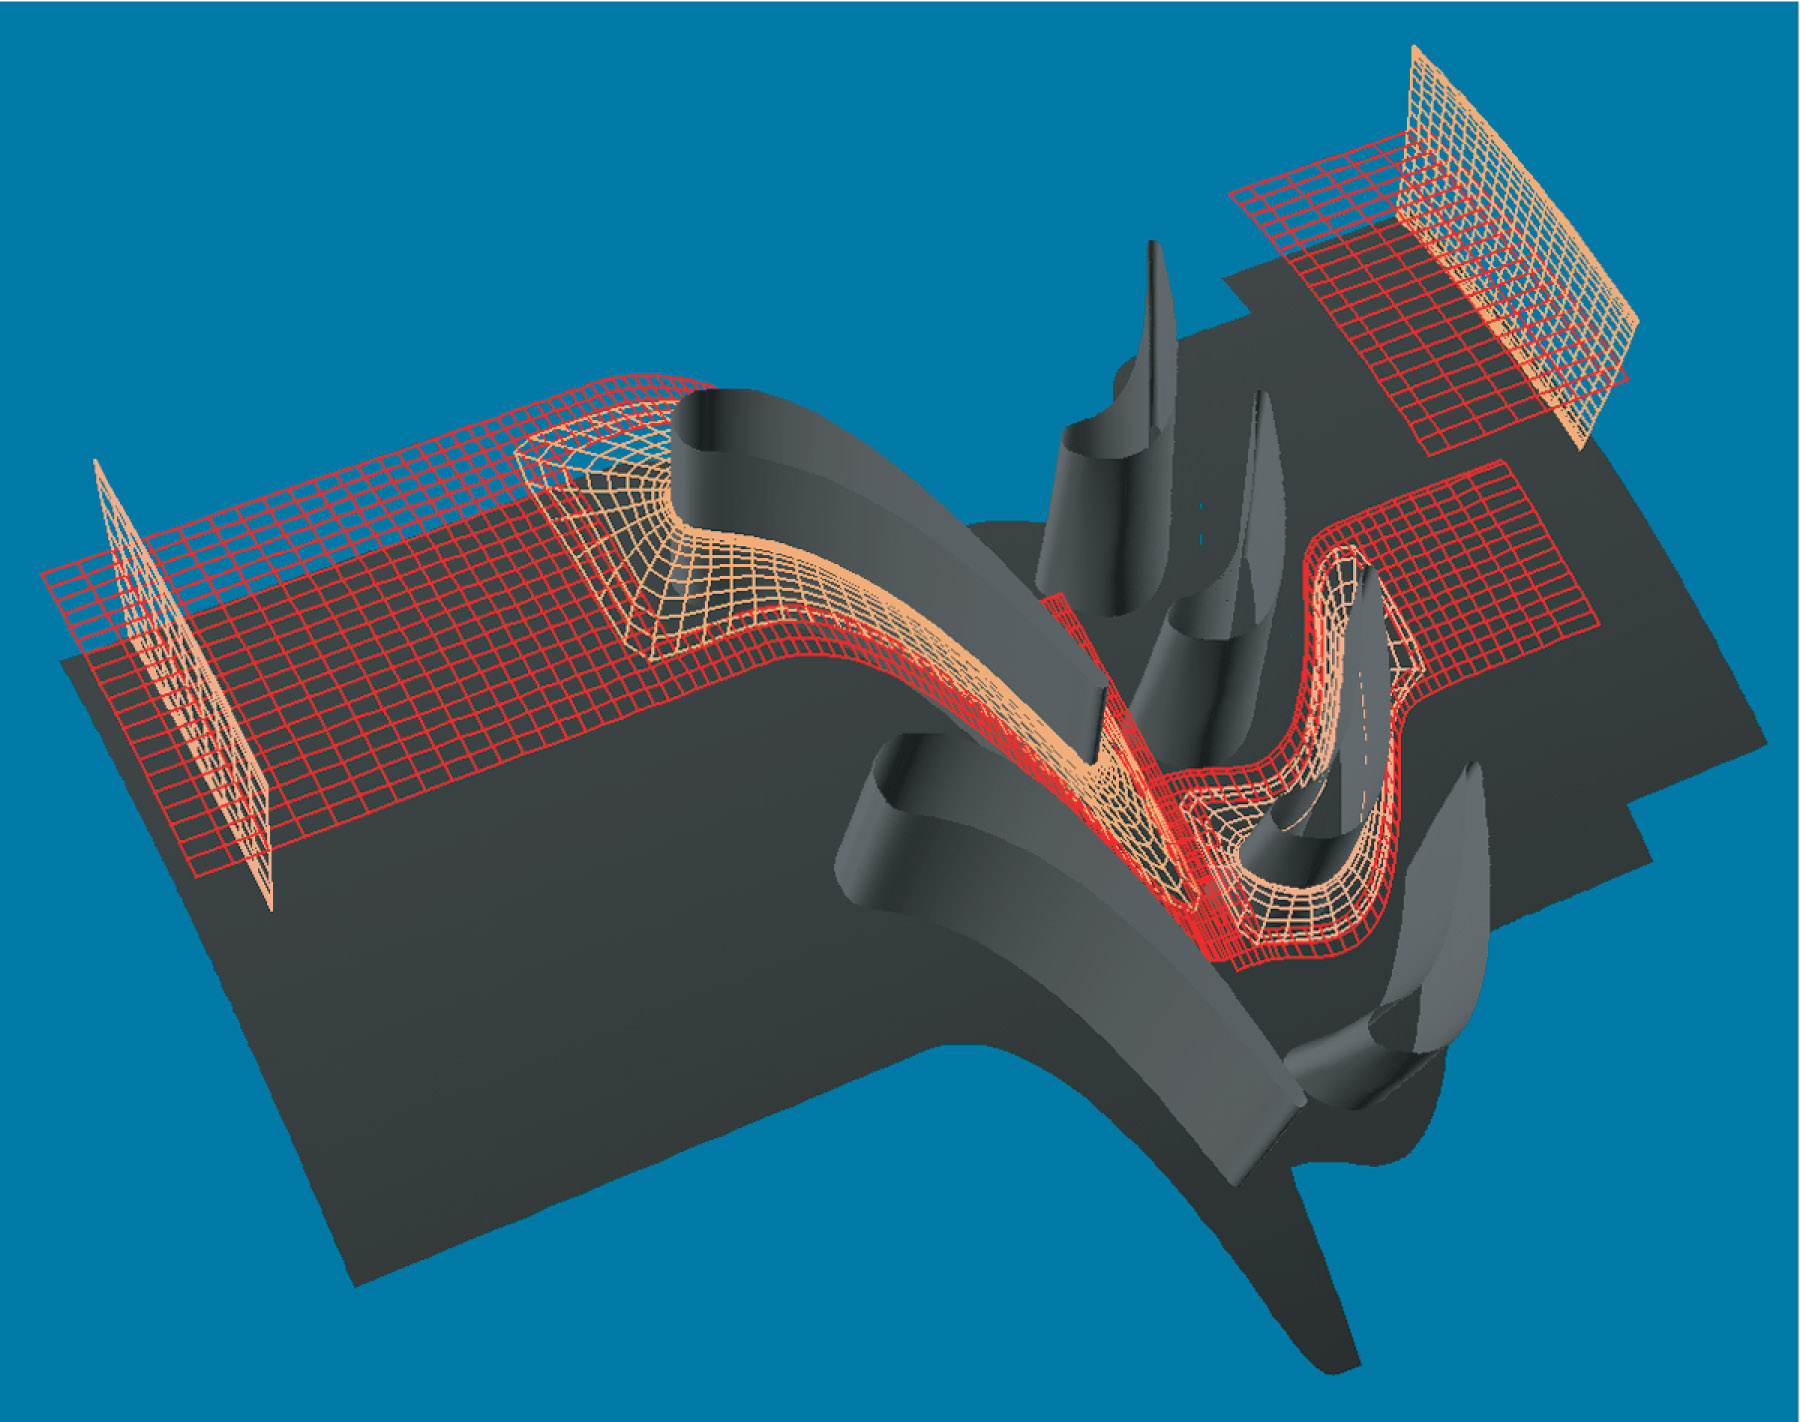
This system has been applied to a 3-D simulation of flow and heat transfer in a turbine stage. Turbine flow fields contain a wide array of phenomena of importance to designers. The flow at the hub of each blade rolls up into a characteristic “horseshoe vortex,” which is convected through the passages. There is clearance at the tip of rotating blades, and this generates a “tip vortex,” which also convects through the domain. Blade surfaces may contain regions of separated flow, particularly at the hub and tip regions of the airfoils. Wakes from airfoils are shed in the form of vortex streets, and these wakes interact with other airfoils in downstream blade rows. The interactive particle-seeding technique is an excellent way to determine the locations of these features.