Sheryl M. Grace – Boston University
Douglas L. Sondak – Boston University
Daniel J. Dorney – NASA Marshall Space Flight Center
Michaela Logue – The University of Notre Dame
Michael J. Cannamela – Boston University
Abstract
There is a great deal of interest in improving the ability to predict the level of noise generated by air breathing jet engines, including that produced by an engine’s fan. In particular, as bypass ratios increase, fan noise becomes a primary source of engine noise. A series of experiments known as the Source Diagnostic Test (SDT) has been performed by NASA with the intent of providing a rich set of experimental data that can be used to validate models of turbofan engine noise. In the present study, a 3-D, unsteady, Reynolds-Averaged Navier-Stokes simulation was performed based on the geometry and flow conditions of one of the SDT test points. The resulting unsteady vane pressures were then used as a boundary condition for the solution of the convective wave equation in a duct. The resulting sound power level at the exit of the fan duct was in good agreement with the experimental value.

Experimental Configuration
The SDT rig was a scale-model fan stage, including nacelle, that is representative of the front end of a current commercial turbofan engine. The rig is shown in Fig. 1. The stage was tested with three different sets of vanes, each at three different operating conditions. In the current study the “cut-off” configuration, which had 22 fan blades and 54 vanes, was examined at the approach power setting. In addition to measuring the sound pressure level at the nacelle inlet and exit, velocity components between the fan blades and the vanes were measured using laser Doppler velocimetry (LDV).
CFD

The flow in the fan stage was simulated using Phantom, a 3-D, unsteady, turbulent Navier-Stokes solver for turbomachinery applications. This is an implicit finite-difference code which uses the General Equation Set method. It is 3rd-order accurate in space and 2nd-order accurate in time. Roe differencing is used for the convective terms and central differences for the viscous terms. Approximate factorization is employed, with factorization errors minimized through the use of a dual time step.

The simulated geometry included 2 rotor blades and 5 vanes, with the vane geometry scaled by 54/55 to maintain the correct blockage. Each passage was discretized with overset o- and h-grids, including tip-clearance grids for the rotor blades. A total of approximately 5×10⁶ grid points were used. The simulation was performed on 16 1.3 GHz processors of an IBM p690. It took 66 seconds wall-clock time for each time step with 2000 steps per cycle, where a cycle is the time for the 2 rotor blades to traverse the 5 vanes.
The resulting time-averaged mid-span wake profile behind the fan blades is compared with the experimental LDV data and with another simulation of the same configuration performed elsewhere in Fig. 2. A contour plot of computed instantaneous axial velocity approximately 0.2 axial chords behind the fan blades is shown in Fig. 3. This figure shows the fan wakes, the tip clearance flow, and the casing boundary layers.
Acoustics

The experimental acoustic data contained no dominant interaction mode at the blade passing frequency (BPF) and a dominant mode (n=-10) at 2 times BPF, so these are the frequencies that were examined. A fast Fourier transform (FFT) was performed on the computed unsteady pressure trace for each grid point on the vane surface using 13 wake-passing cycles with 1000 points per cycle. A typical result is shown in Fig. 4 for a mid-span leading-edge point. Contour plots of the real part of the vane surface pressure FFT at BPF and 2 times BPF are shown in Fig. 5.
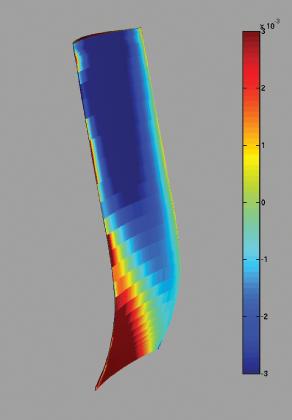
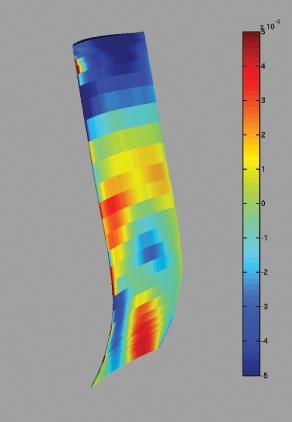
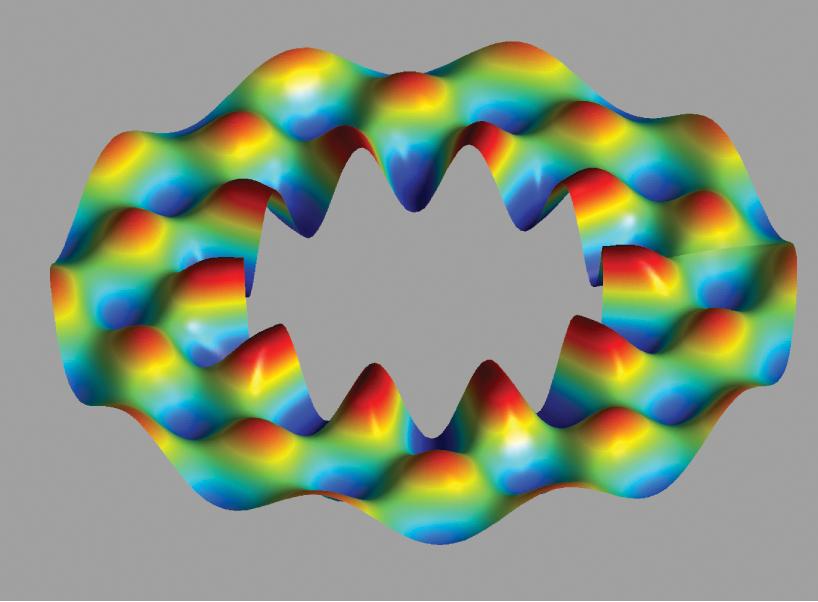
The convective wave equation was solved analytically assuming a constant-area, infinite, annular duct using the actual vane geometry and the forcing from the CFD simulation. As in the experiment, the BPF case was shown to be cut off and the 2BPF case cut on. A sample mode shape, for circumferential mode -10 and radial mode 3, is shown in Fig. 6 below. The experimental value for the power level at the nozzle exit at 2 times BPF at the n=-10 mode was 105 dB. At this same axial location in the duct in the analysis, the power level computation gives 99.6 dB.
Visualization Sequences
These movies were originally shown in stereo on our traveling high-resolution stereo display at the Supercomputing 2007 conference at a resolution of 2048 x 1536. For the web version here, they have been downsampled to 720 x 540 mono and are available in the Microsoft AVI and Apple Quicktime video formats. Scientific visualization by Erik Brisson, of the Scientific Computing and Visualization group at Boston University.
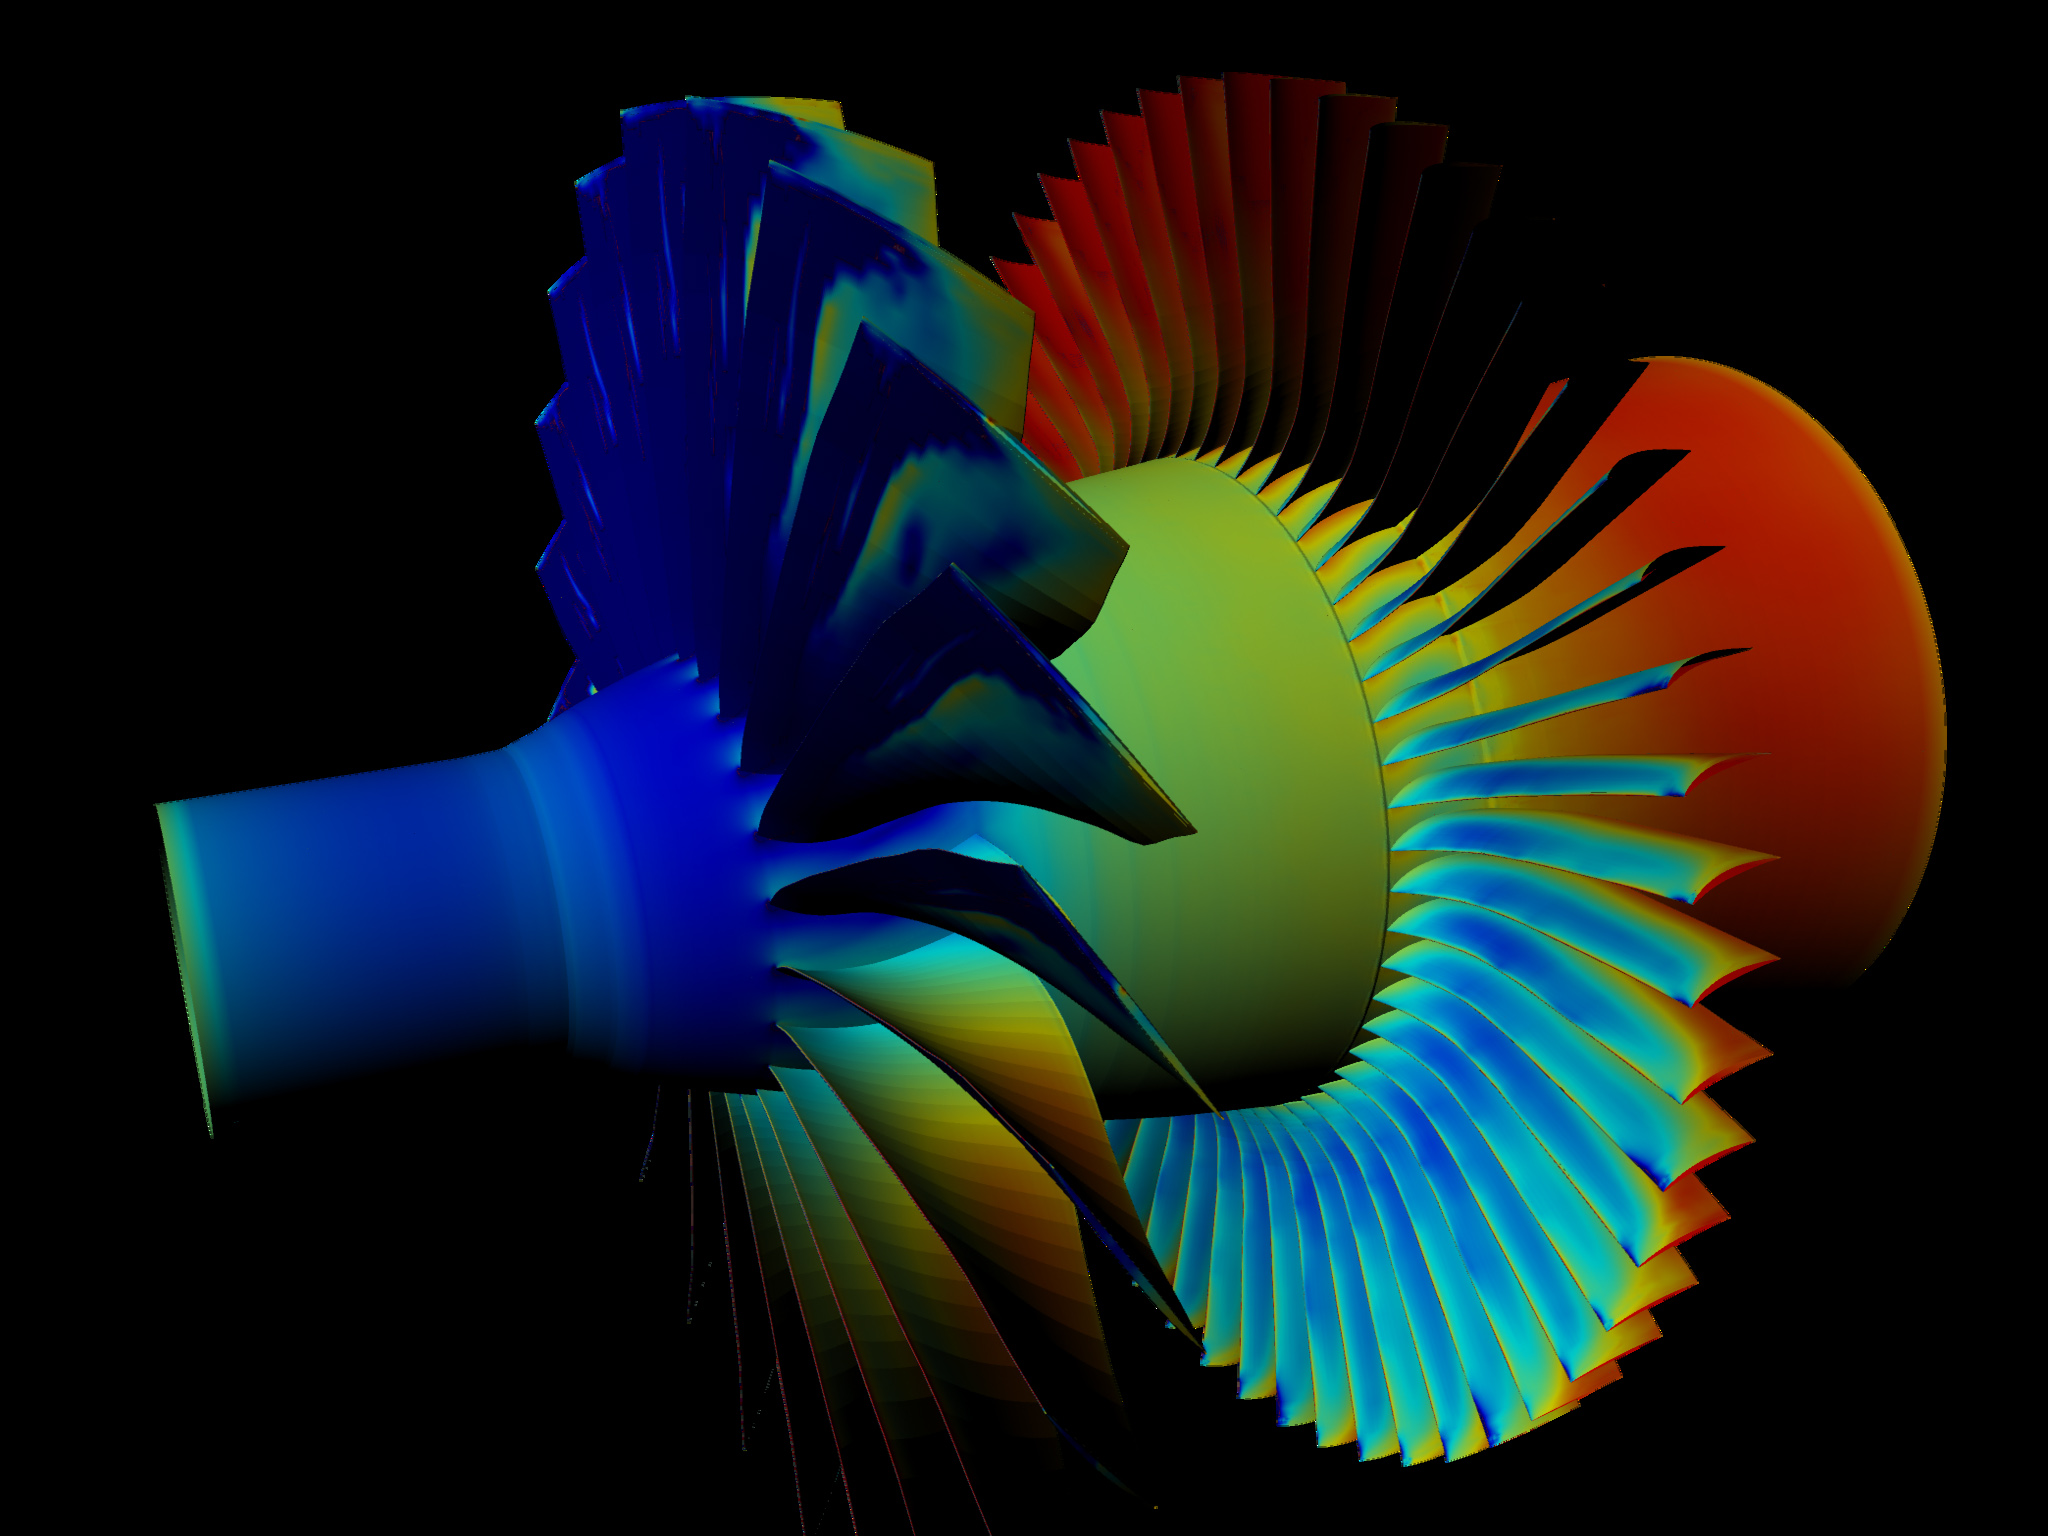
This movie shows the results from a simulation of the 3-D, unsteady, turbulent flow through the NASA Source Diagnostic Test (SDT) experimental fan rig. The fan blades, vanes, and hub flowpath are colored by static pressure, showing several interesting features. The simulation was performed at an off-design condition (approach), and the fan shows separation on the suction surface near the leading edge. The highly unsteady nature of the separation can be seen in the pressure contours. The simulation included modeling of the fan tip clearance flow, and the unsteady interaction of the fan tip vortices with the vanes can be seen in the vane tip region. Note that the data for this animation were taken before the simulation had finished passing transients from the initial condition out of the domain, and a pressure wave can be seen moving from the exit to the inlet. (23 MB AVI, 205 MB QuickTime)
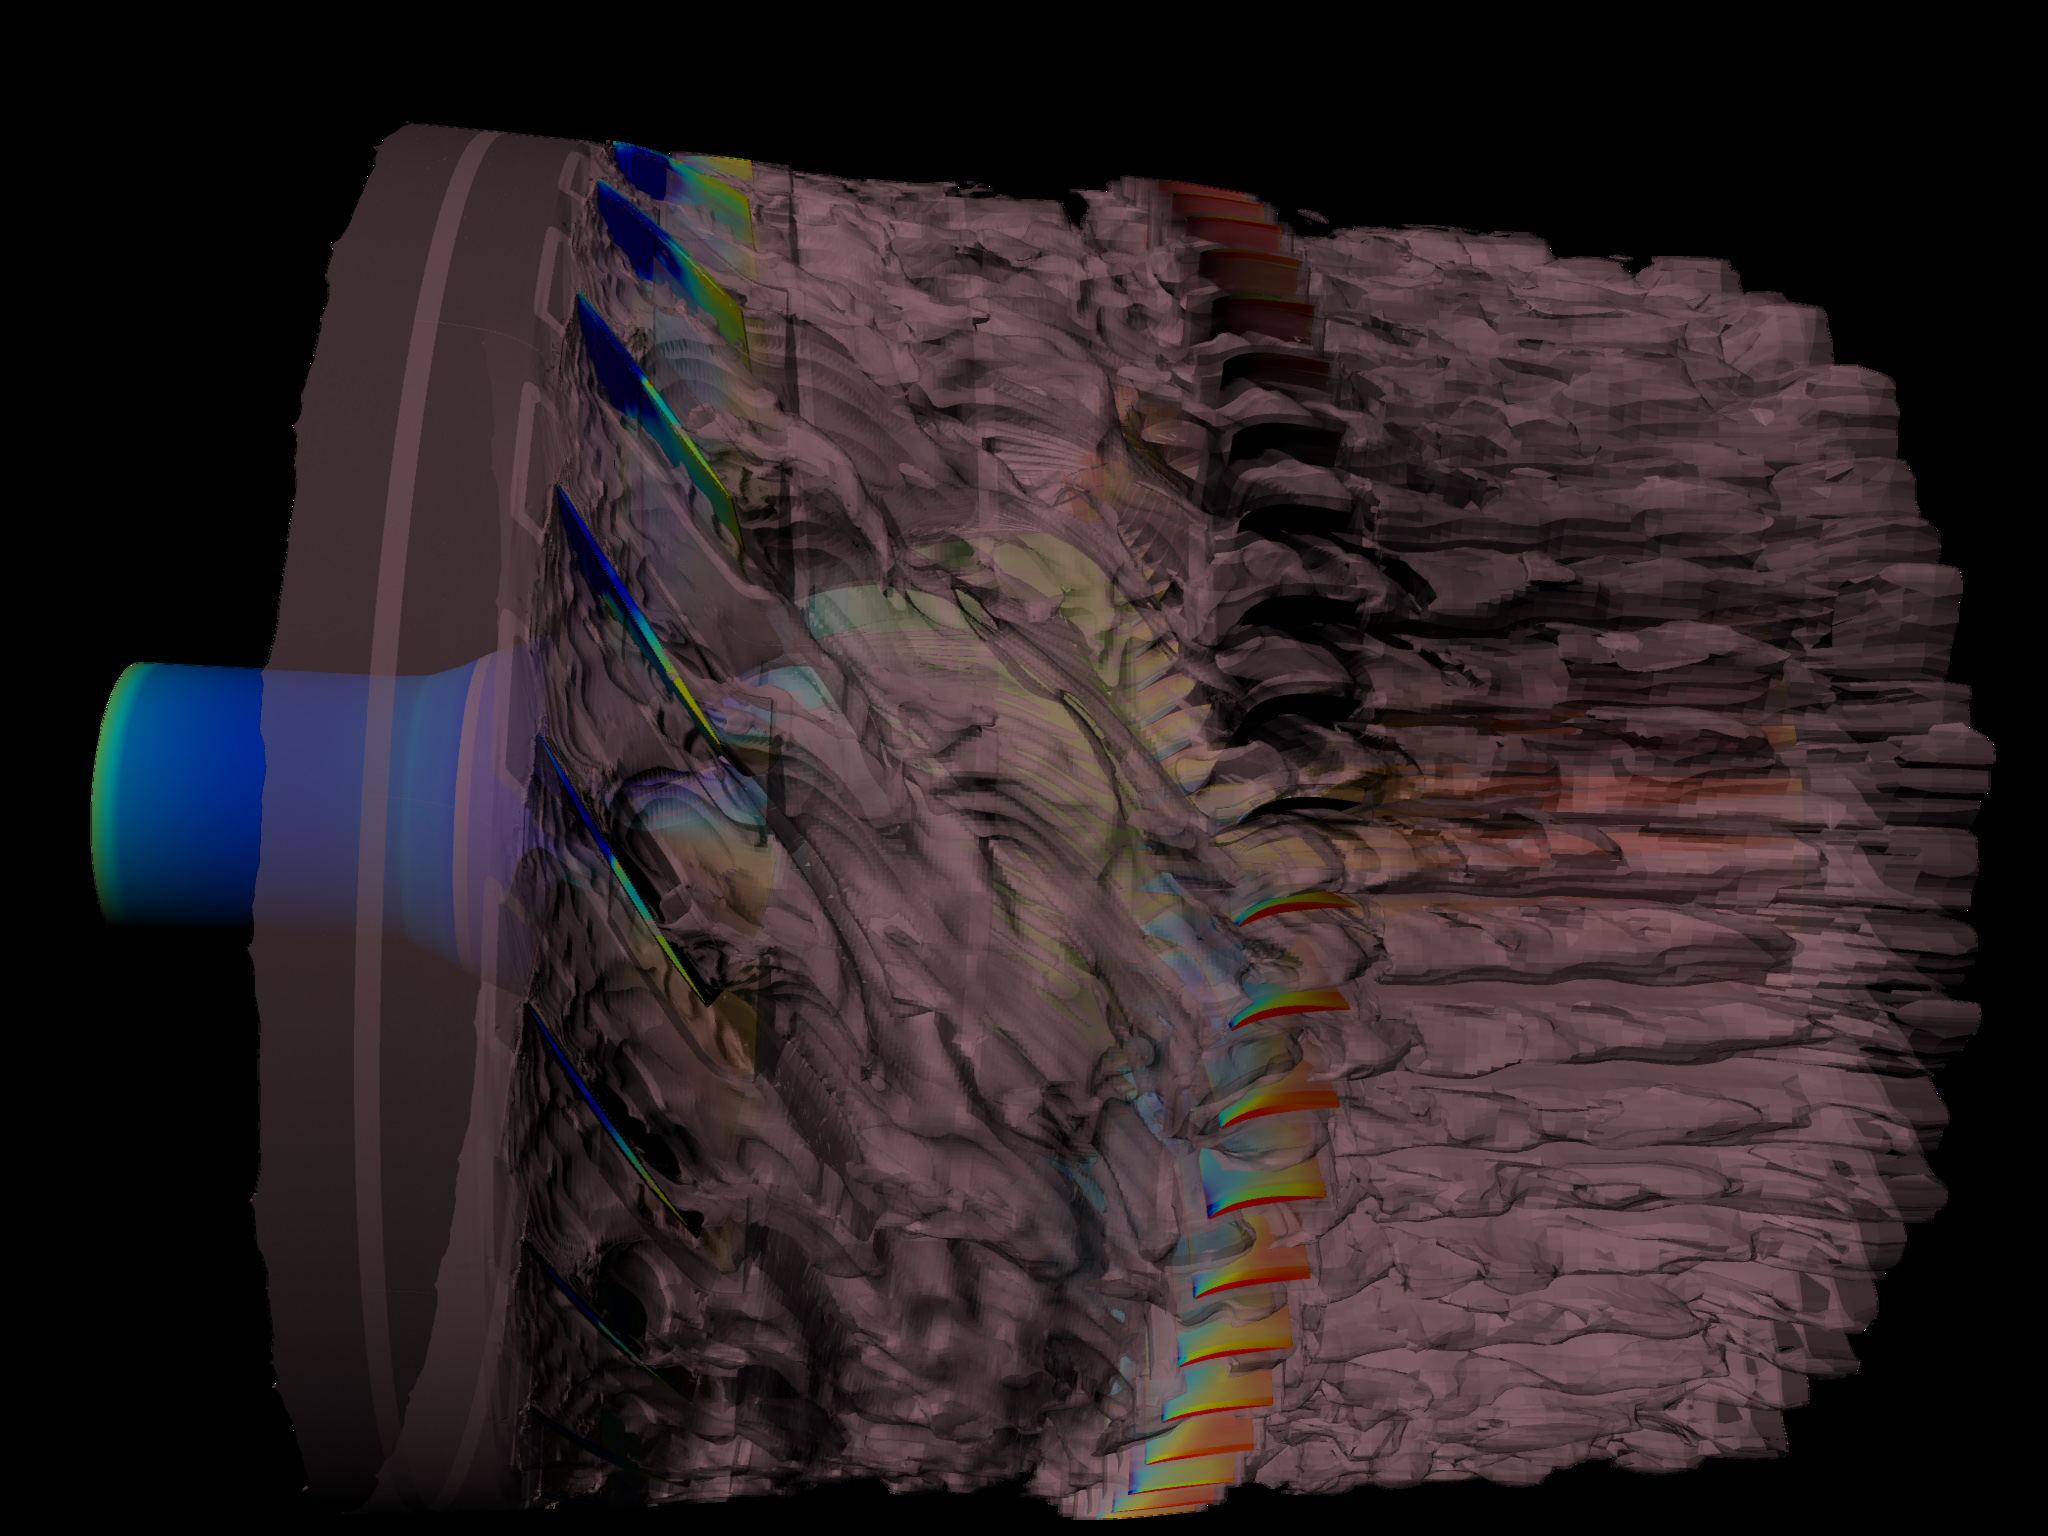
This movie shows the results from a simulation of the 3-D, unsteady, turbulent flow through the NASA Source Diagnostic Test (SDT) experimental fan rig. Isosurfaces of entropy are shown to visualize the interaction between the fan wakes and the vanes, and blade and hub flowpath surfaces are colored by static pressure. The fan wakes appear to start rolling up approximately half way between the fan and the vanes. The vane surface pressures in the tip region can be seen to have a great deal of unsteadiness as the fan wakes interact with the vanes. The fan wakes take on the characteristic hairpin shape in the vane passages, and the chopped-up fan wake segments interact with the vane wakes further downstream.(30 MB AVI, 292 MB QuickTime)
Conclusion
The present method has been shown to be able to predict the cut-on/cut-off behavior and exit acoustic power level for a test point of the SDT experiment. The next step will be to perform similar calculations on other SDT conditions and configurations to gain confidence in the method.