Daniel Mocanu1, Joachim Kettenbach2, Michael O. Sweeney3, Bruce H. KenKnight4, Ron Kikinis2 and Solomon R. Eisenberg1
1 Dept. of Biomedical Engineering, Boston University, Boston, MA, U.S.A.
2 Surgical Planning Lab., Brigham & Womens Hospital, Boston, MA, U.S.A.
3 Division of Cardiology, Brigham & Womens Hospital, Boston, MA, U.S.A.
4 Dept. of Therapy Research, Guidant/CPI, St. Paul, MN, U.S.A.
Introduction

The implantable cardioverter-defibrillator (ICD) is a sophisticated electronic device designed to sense life threatening cardiac arrhythmias and to restore the normal sinus rhythm by applying electric shocks of various strengths. The highest energy shock is delivered in the case of ventricular fibrillation (VF). In the standard configuration, the ICD is surgically implanted subcutaneously in the patient s chest, with two catheter electrodes inserted in the superior vena cava (SVC) and the right ventricle (RV) (fig. 1). Typically, the shock energy is delivered via a dual-current pathway from the RV electrode to the SVC electrode and the metallic enclosure (CAN) of the ICD.
Specific Aims
The primary goal of this research was to assess the predictive capacity of patient-specific computational models of transvenous defibrillation by comparing patient-specific simulated and clinically measured defibrillation energy thresholds. The secondary goal was to develop advanced computer visualization tools for the analysis of electric field distribution during defibrillation shocks.
Research Protocol
Recruit nine patients with ICD implants.
Image each patient with CT scanner post implant.
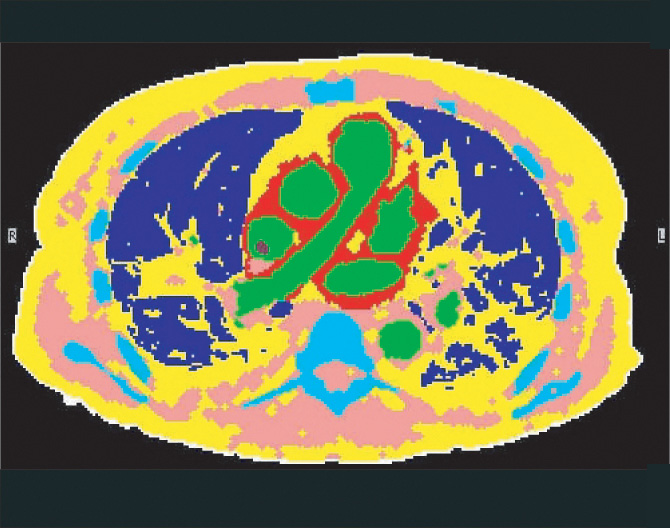
Segment cross-sectional CT images of the thorax (fig. 2).
Construct computational models based on segmented images.
Solve for electric field (current density) distribution.
Compare clinical and simulated defibrillation threshold energy.
Visualize simulated electric field distribution during defibrillation shocks.
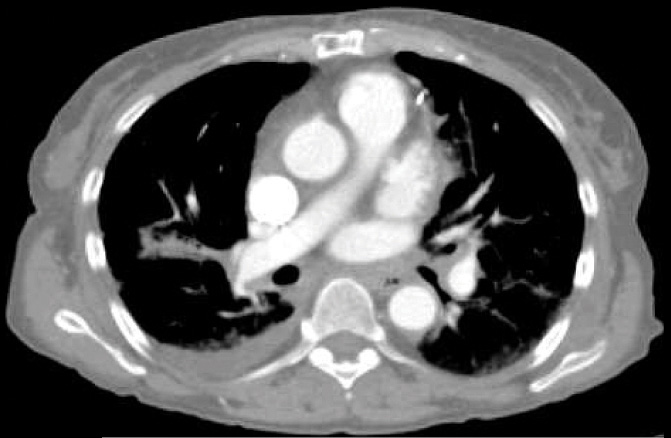

a) CT image
b) tissue boundary identification
c) tissue classification
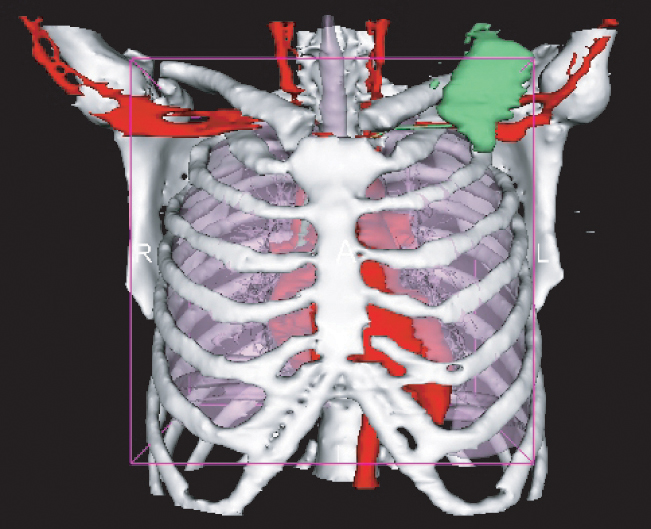
d) 3-D reconstruction of thoracic anatomy
Computational Modeling
The computational models were constructed using a structured meshing algorithm in which each voxel in the segmented data set was defined as a volume element in the computational model. The electric potential Φ produced by a defibrillation shock is governed by the elliptic partial differential equation:
- ∇
 σ∇Φ = 0 (Equation 1)
subject to boundary conditions:
- i) constant potential on the electrodes (Dirichlet);
- ii) no current flux on the thorax surface (Neumann homogeneous).
IBM-BU Defibrillation Demo

An interactive demo for investigating the effects of implanted electrodes placement was developed by Greg Abram from the IBM T. J. Watson Research Center and Maria Iordache from IBM Life Sciences, in partnership with members of the Boston University Scientific Computing and Visualization Group. The demo consists of two principal components: a visualization application and a finite element solver.
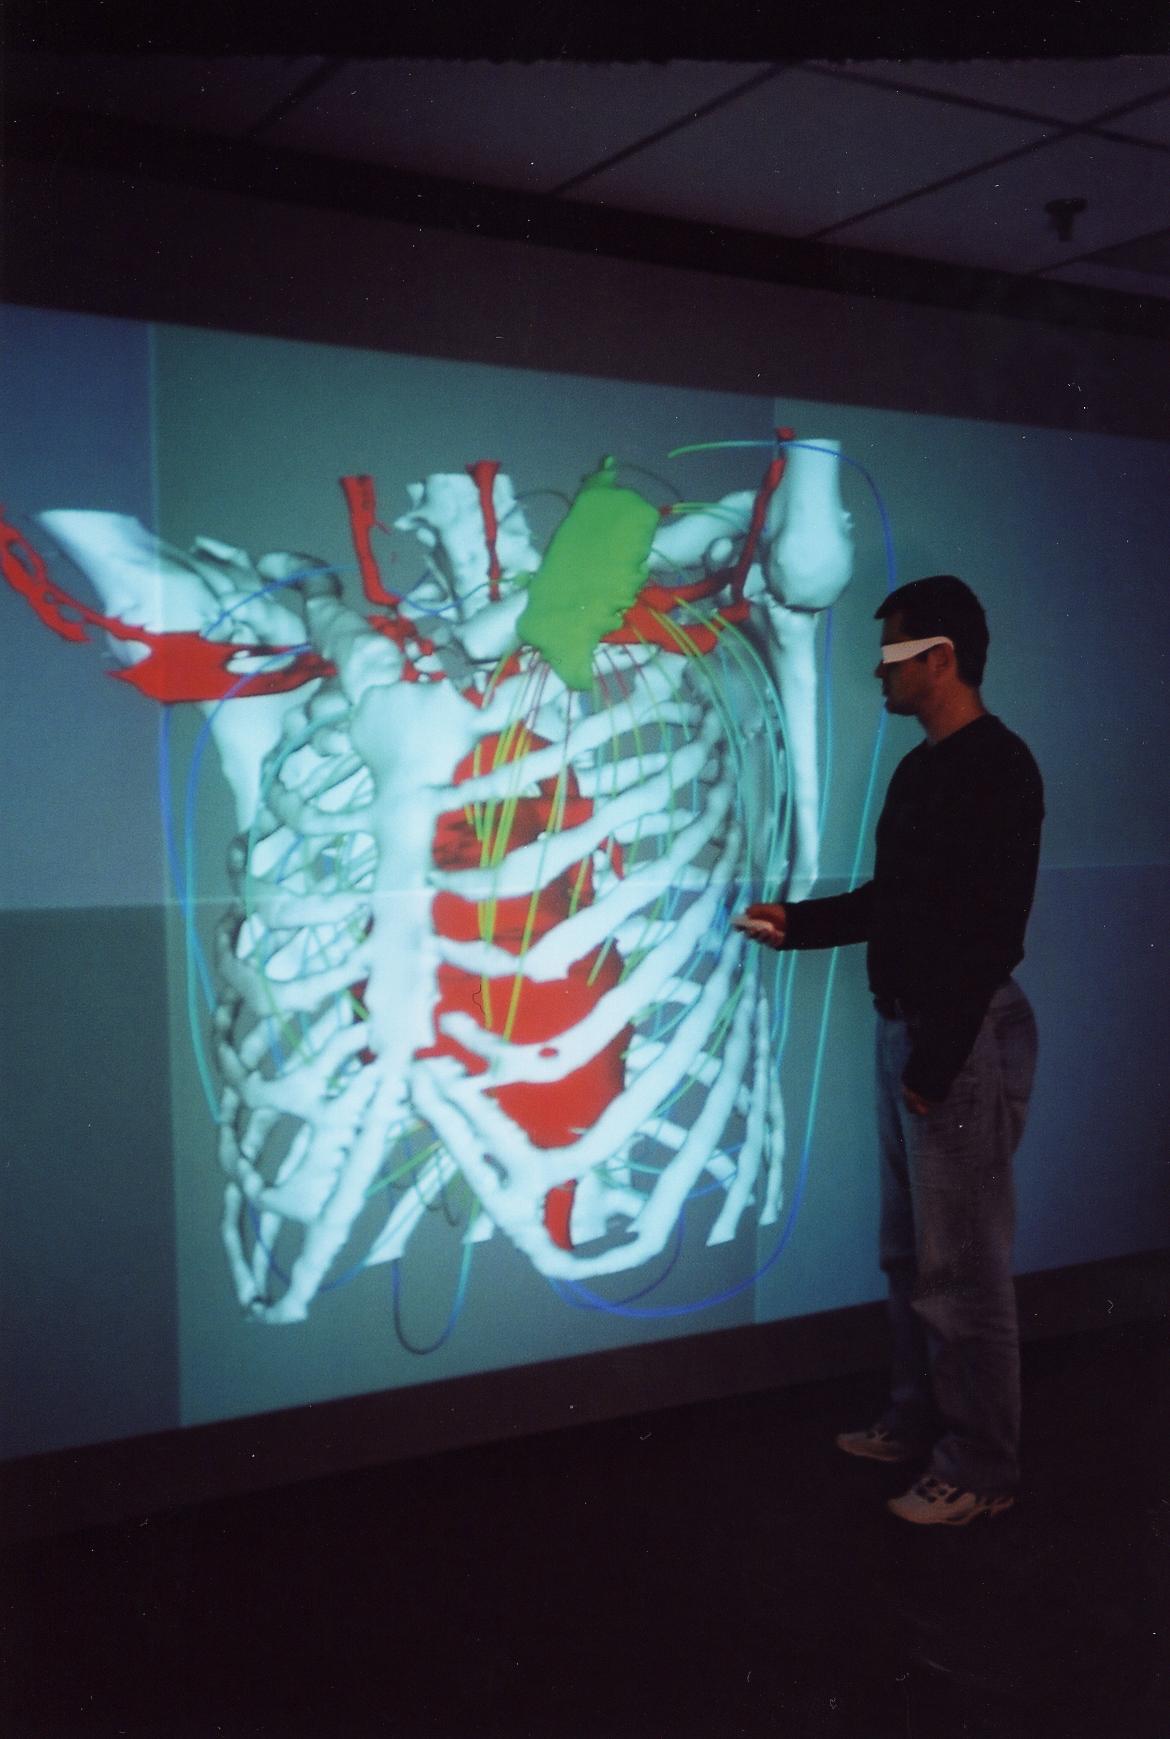
The visualization application allows a user to control feature display (heart, lungs, bone, etc.), virtual camera position, and defibrillator electrode position. The electrical field is indicated by streamlines in the gradient of the potential field (fig. 3). This application is being run on an IBM Pentium 4 IntelliStation under Red Hat Linux, is built on a customized version of OpenDX, and can render to Boston University’s Deep Vision Display Wall.
The finite element solver is running on a 32-processor IBM pSeries 690 system. The solution to eq. (1) is obtained with WSMP, a parallel linear equation solver developed at IBM T.J. Watson Research Center. Communication between the visualization application and the solver program uses standard Unix sockets over TCP/IP.
The following MPEG videos shows a 360 degree rotation of a 3D reconstruction of the thoracic anatomy and simulated electric pathways during defibrillation shock. (3.7 MB MPEG or higher resolution 11.6MB MPEG)
Summary
Patient-specific computational modeling of defibrillation provides new insights regarding the interplay between shock electric fields and individual patient anatomical features and may be used for presurgical planning for ICD implantation by providing estimates of the individual energy requirements for successful defibrillation.
The computational models also allow the visualization of electric field distribution and can be used as a convenient testbed for evaluating new electrode configurations.
Acknowledgments
This study was supported by a grant from Cardiac Pacemakers Inc., St. Paul, MN, and the Trustees of Boston University. The excellent support provided by the Scientific Computing and Visualization group, Boston University, is also acknowledged.