Communicating Data.
Integrating data and research into your writing can strengthen your argument in public health. You must clearly present and communicate how the data fits into your paper. This section can help you discern the best way to communicate your data and engage readers in your research.
The first step to communicating data is deciding how to display them. Generally, data are displayed in either tables or graphs. Tables are better for communicating precise numbers, while figures are better for displaying patterns and relationships (1). For information on how to choose the best visual representation for your data, visit:
- BUSPH Data Presentation Module
- Making Data Talk: A Workbook by National Cancer Institute
- Flow Chart for Choosing a Chart
- Perceptual Edge – Selecting the Right Graph for Your Message
Incorporating and Describing Data
After choosing and creating visuals for your data, you should include remarks about how the data relates to your paper. Never insert a table without referencing it in the text either by name or table number. When writing about data, be sure to go beyond describing it; instead, your writing should incorporate an analysis and discussion of how the data fits into the purpose of your paper (2). Academic Writing for Graduate Students states the following elements should be included in your data commentary:
- “Location elements and/or summary statements” (2). Include the location and timeframe of the data.
- Example: Figure 2 illustrates the trends of health care spending from 2007-2010.
- “Highlighting statements – generalizations that you can draw from the details of the data displayed” (2).
- Example: According to these results, health care spending is rising.
- “Discussion of implications, problems, exceptions and/or recommendations”(2).
- Example: Increases in hospital spending are a major driver of health care spending; therefore, health care policy should focus on reducing this area of health care expenditures.
When writing about data, consider including statements that address these three points to enhance your discussion.
Using Figures and Tables
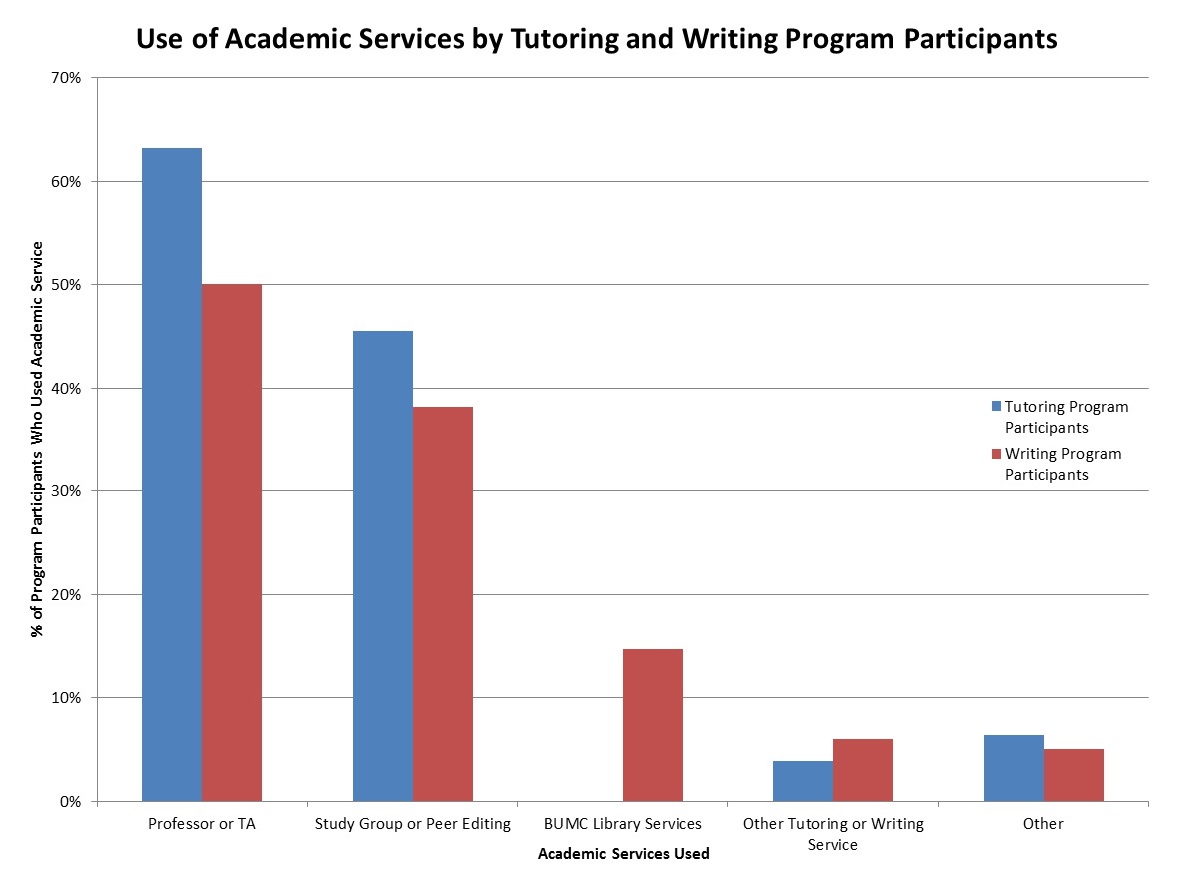
For both figures and tables, it is essential to include a title and include the figure/table number. For example, “Figure 3: Competing Academic Services by Program Type” or “Table 5: Percent of Program Participants by Number of Credits, 2010-2014.” You should refer to the data in the main text by explaining a key point, then referencing the chart. For example, you might say “For both programs, most students sought out a professor or TA for additional academic assistance (see Figure 3).” With both types of data presentation, you should include the date/year whenever appropriate, particularly if you’re comparing trends across time periods.
Creating Figures
When creating a chart, you should clearly label all axes, including the unit type if you have numerical values, and include a legend if you are comparing multiple groups (3). Make sure that the horizontal and vertical scales for the figure accurately reflect the results (3).
Unless it is the standard operating style in your organization, you strongly avoid using 3-D charts as they do not convey a professional tone and can be distracting to interpret. You should also avoid unnecessary detail. For example, unless there are minute differences between values that you wish to illustrate, it may not be necessary to show decimal places. Furthermore, if you are using millions (or higher) on either axis, you can just format to show smaller unites. For example, instead of using 10,000,000 and 20,000,000, you may use 10 and 20 while using “millions” as the units.
Below is an example of a simple figure:
Figure 3: Use of Academic Services by Tutoring and Writing Program Participants Type
Creating Tables
When creating a table, you should also clearly label the rows and columns, including the unit type if you have numerical values (3). If appropriate, you should also provide the column/row totals (3). If have many columns of data, you might consider keeping the gridlines on or utilizing row shading to ensure that the reader can follow the trends.
Below is an example of a simple table:
Table 5: Percent of Program Participants Per Year by Number of Credits, 2010-2014

Additional Resources
For more information, visit the following resources:
- Six Simple Techniques for Presenting Data
- BUSPH Descriptive Epidemiology Module on Data Presentation
- University of Leicester – Presenting Numerical Data
- BUSPH Environmental Health Resources
- Information on creating graphs and charts:
References
- Booth W, Colomb G, Williams J. The craft of research. 3rd ed. United States of America: University of Chicago Press; 2008.
- Swales J, Feak C. Academic writing for graduate students. 2nd ed. United States of America: University of Michigan Press; 2004.
- Lamorte W. Data Presentation [Internet]. Descriptive Epidemiology. [cited 2015 Apr 1]. Available from: http://sphweb.bumc.bu.edu/otlt/MPH-Modules/EP/EP713_DescriptiveEpi/EP713_DescriptiveEpi7.html#datapresentation