Injuries and the Health of the Public.
 Before we resume our schedule of Dean’s Notes, an acknowledgement of recent events. The violence and Charlottesville and Barcelona have shown us, once again, the public health consequences of hate. Hate remains a persistent threat to the health of populations, yet it is inspiring to see reaffirmed, as we did last weekend in Boston, that the vast majority of people reject hate and will not stand for it in their communities. As we prepare for the next academic year, it is my hope that we will see, in the coming months, the tide of hate start to ebb, as the events of the last few weeks galvanize our country, and our world, against violence and the voices that promote it.
One more thought. As I write this we are watching with some concern the arrival on Hurricane Harvey on US shores. I have written before on the consequences of disasters, and our thoughts are with those in the path of the storm.
Now, on to today’s note, which builds off a previous Dean’s Note, focusing on another force that undermines the health of populations, one that is often overlooked in public health. I have written previously about trauma, and the threat trauma poses to the health of populations. For today’s Note, I will focus on a subset of trauma, injury, which is well worth deeper consideration, given the lack of attention it receives relative to its effect on the health of populations.
By and large, our national investment in efforts to mitigate disease matches disease burden. This has consistently not been the case where injuries are concerned. Figure 1 shows the ratio of the proportion of National Institutes of Health (NIH) funding to the proportion of total disease burden in terms of Disability Adjusted Life Years (DALYs). The proportion of NIH funding for injury research is about 12 percent lower than the burden of death and disability for injuries in the US population. By contrast, funding for HIV/AIDS is about 17 percent greater than its associated disease burden in the US population. A note, then, on the often-overlooked burden of mortality and morbidity that is driven by injury.

Is the amount of disease-specific NIH funding related to burden of disease? Dot Data Web site. http://dotdata.cc Accessed July 24, 2017.
Mortality
As shown in Figure 2, unintentional injuries are the fourth leading cause of mortality in the US. In 2014, unintentional injury mortality was the primary cause of death for people aged one to 44 years, contributing substantially to potential years of life lost (Figure 2).
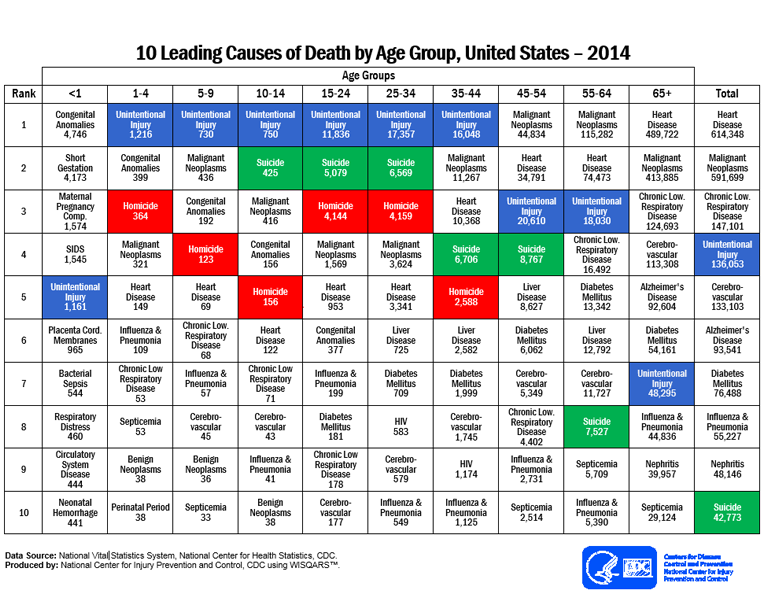
Centers for Disease Control and Prevention Web site. https://www.cdc.gov/injury/wisqars/pdf/leading_causes_of_death_by_age_group_2014-a.pdf Accessed July 24, 2017.
Of concern is the fact that, from 2010 to 2014, at a time when death rates declined for most leading causes of death (e.g. heart diseases, cancer, and stroke), age-adjusted death rates for unintentional injuries increased by 23 percent (Figure 3).

Centers for Disease Control and Prevention (2016). Potentially Preventable Deaths Among the Five Leading Causes of Death — United States, 2010 and 2014. MMWR. 65(45).
Morbidity
Beyond mortality, injuries are associated with a high morbidity burden, both within the US and globally. As an example, motor vehicle-related injuries are associated with a large burden of DALYs, particularly in low- and middle-income countries. In 2014, there were 1,224,750 people who died from road traffic injuries (RTIs), with a loss of DALYs equal to 40,738,000 years. Among the top 25 countries with the greatest number of DALYs lost due to RTIs, 24 countries were low- and middle-income, with China in the lead for the greatest burden of DALYs lost. The only high-income country on this list was the US, ranking fifth in terms of DALY loss.
Severe motor vehicle accidents are associated with both physical disability and with psychological consequences, such as depression, anxiety, and post-traumatic stress disorder (PTSD), which are further adversely associated with quality of life (QOL). Similarly, injuries caused by falls can decrease quality of life, both physically and psychologically. The National Council on Aging suggests that a growing number of older adults are concerned about falling, and, consequently, tend to limit their activities and social engagements. Unfortunately, this behavior can lead to even more physical decline, as well as depression and social isolation.
Leading causes of injury morbidity and mortality
Unintentional poisoning deaths are the leading cause among all injury deaths, the preponderance of which result from drug overdose, particularly from opioid pain medications such as methadone, hydrocodone, or oxycodone. Mortality caused by drug overdose has increased 137 percent, which includes a 200 percent increase in the rate of overdose deaths that involve opioids since 2000. In 2014, there were approximately one and a half times the number of deaths caused by drug overdose than the number caused by motor vehicle crashes. I have written about the US opioid epidemic in a prior Dean’s Note.
Motor vehicle accidents, occurring at a rate of one motor vehicle fatality every 16 minutes, are the second leading cause of unintentional death after the rise in drug overdoses. In 2013, the motor vehicle crash death rate in the US was more than twice the average of many other high-income countries; these deaths resulted in more than $380 million in direct medical costs (Figure 4).

Motor Vehicle Crash Deaths: How is the US doing? CDC Vital Signs. https://www.cdc.gov/vitalsigns/pdf/2016-07-vitalsigns.pdf Accessed July 24, 2017.
Top contributors to this high death rate include not using seat belts, drunk driving, and speeding. In the US, where front seat belt use was lower than most other high-income countries, 30 percent of motor vehicle crash deaths involved drunk driving or speeding. Unlike poisoning deaths, the rate of unintentional motor vehicle traffic deaths evinced a steady decline from 2004 to 2013. However, US reductions in crash deaths were still the lowest compared with other high-income countries.
Fall-related injuries are the leading cause of non-fatal injuries resulting in hospitalization, and are the third leading cause of fatal injuries in the US, particularly among older adults. In 2013, unintentional fall-related injuries cost $34 billion. Suicide is another driver of the burden of injuries. Suicide affects people of all ages, races, and ethnicities, and is one of the leading causes of death for all ages in the US. Although the rate of firearm injuries and deaths has generally decreased, firearm suicides have recently increased. In 2014, injury deaths caused by firearm suicide was the fourth leading cause of fatal injuries, and accounted for nearly 52 percent of all suicides.
Overall, in 2013, fatal injuries in the US resulted in $214 billion worth of lost work and medical costs.
Prevention of injuries and their consequences
There are several approaches to preventing injuries, each particular to the type of injury in question. For example, efforts to prevent opioid overdoses include administration of naloxone (or Narcan) to reverse opioid poisoning. Recent evidence shows that providing naloxone and appropriate training to people who are likely to witness opioid overdoses could reduce opioid deaths. From 1996 to 2014, naloxone distribution programs have saved more than 20,000 persons who experienced opioid-related overdose. In 2016, CDC published an opioid prescription guideline, which encouraged physicians to use non-opioid therapy or use the lowest effective dosage. Meanwhile, the Drug Enforcement Administration (DEA) planned to cut down on the opioid supply in 2017, making opioids less accessible. Paradoxically, limits on the supply of opioids will reduce risks of overdose among some, but may also impose limits on appropriate opioid use for relief from injury-related pain for others.
The prevention of motor vehicle injuries is one of the sentinel triumphs of public health prevention. While the mortality rates increased for injuries caused by drug overdose, fall, and firearm suicide, there has been a steady decline in motor vehicle crash-caused injuries and deaths from 2000 to 2014. Reductions in both motor vehicle-caused deaths and injuries have resulted from safety efforts such as increased seatbelt use, campaigns against drunk driving, and vehicle safety technologies such as air bags and electronic stability control. These recent changes follow roughly a century of improvements in motor vehicle safety, reducing the number of motor vehicle deaths even as vehicle miles traveled skyrocketed (see Figure 5).

Centers for Disease Control and Prevention (1999). Achievements in public health, 1900—1999: Motor vehicle safety. MMWR. 48(18).
Looking ahead
Injuries remain a leading cause of morbidity and mortality worldwide, amounting to a substantial burden of disease. Efforts to mitigate the consequences of injury have yielded success in some areas, leaving much work to be done in others. Further efforts in reducing the consequences of injury will need to focus on primary prevention, including, for example, efforts to limit ready access to opioids, and measures to reduce distracted driving. This is entirely consistent with the goals of public health: to improve the full range of conditions that preserve health, paying due attention to an issue that is responsible for substantial loss in healthy life years.
I hope everyone has a terrific week. Until next week.
Warm regards,
Sandro
Sandro Galea, MD, DrPH
Dean and Robert A. Knox Professor
Boston University School of Public Health
Twitter: @sandrogalea
Acknowledgement: I am grateful to Gregory Cohen, MPhil, MSW, and Shui Yu, MA, for their contributions to this Dean’s Note.
Previous Dean’s Notes are archived at: https://www.bu.edu/sph/tag/deans-note/