A Q&A with Dino Christenson: “A Better Way to Predict Election Outcomes”

The mid-morning coffee “rush hour” at Pavement Cafe was in full swing. Students were either studying at their tables, laptops and books fully spread out, or standing in a long line waiting to order their favorite drink. This is where I had a chance to sit down with Dino Christenson in late January. Dino is an Associate Professor and the Director of Advanced Programs in the Department of Political Science. He is also a Faculty Affiliate at the Hariri Institute for Computing and sits on the Steering Committees for the Institute and the Data Science Initiative.
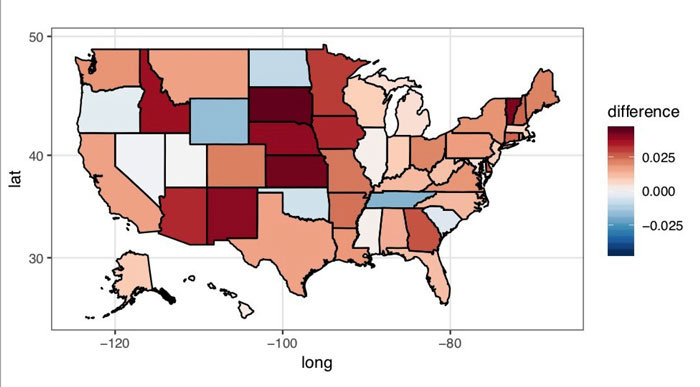
Last November, Dino was highlighted in BU Research in an article titled “A Better Way to Predict Election Outcomes” by Art Jahnke. The article covered how their data analysis methodology can use people’s browser behavior to measure shifts in political leanings down to the minute in localized areas. The article mentioned, “All the data the researchers used was specifically authorized and released for this kind of research by the users who generated the data. The researchers’ analysis of that data—two terabytes worth containing 70 million websites—showed exactly when and where voters made decisions that led to the election of Donald Trump.”
Back to the coffee shop, Dino took a bite from his early-lunch sandwich, “I didn’t have any breakfast, so I’m starving” he mentioned. Also, I was on my second cup of coffee and asked him the following questions in an effort to dive further into the background of his project.
What Inspired You to Do This Project?
One of the things that make social science so difficult is measurement. While the natural sciences have gotten pretty good at measuring things, it’s more challenging for us. Political, social, and economic attitudes, opinions and behaviors aren’t easily captured. While polling can be pretty good at this, high costs and a lack of time frequently combine to hamper inferences from this tool. For example, many polls have a hard time picking up fine-grained movements in particular locales and at particular times. I see this project as having the potential to provide a reliable and valid measure of this nature that is not limited by time, money or location, and therefore can provide unique insights into a number of substantive questions across a host of fields. Indeed, while our first paper focused on inferring presidential candidate preferences from web browsing behavior, this is only one of several potential opinions and behaviors we could construct from our web data and methodology. The applications are virtually endless.
What Challenges Did You Have to Overcome?
The project takes on a number of challenges and offers some novel solutions. We had to determine which of the various aspects of web browsing were most informative for the political question at hand. To train a model of individual user behavior without per-user training labels, we had to figure out how to use state and county level polls as ground truths, across which the amount of data varies substantially. We wanted to closely look at the predictions not just in terms of geography but also in terms of time, and so we had to figure out how to get daily estimates when we know that folks’ web activity is different depending on the day of the week.
What Moment(s) During the Process Made You Excited About Your Work?
My excitement for the project began when Mark and I first spoke about it. Really, from day 1 there seemed to be a good deal of overlap in our questions, objectives, and approach to data science, but also important differences in our expertise and methodologies that we could leverage in a project of this nature. And it seems we are steadily finding new reasons to be excited about it. For example, one of the findings that I found most exciting when working on our first piece was that the drop in preferences for Clinton appears to have started before the infamous Comey letter, suggesting that it might not have had as much of an impact as the conventional wisdom would have us believe.
Where Do You Intend to Push Your Project Next?
The project has three big next steps, from my perspective. The first is to expand the kinds of opinions and behaviors we can predict from this methodology. That is, establish the population of measures we can pull from this approach. The second is to figure out how fine-grained we can get them, both spatially and temporally. The third and final is to make the measures rapidly and cost-effectively available to the research community. In doing so, we will ensure strong privacy protection of the data by creating efficient privacy-preserving learning methods—a big challenge in its own right.
If You Could Do 1 Thing Differently About the Project, What Would It Be?
Dedicate even more time to it. However, my 2-year-old has a way of making time go by way too quickly these days.
What Collaborations Are You Thankful For?
Where to begin?! I generally enjoy collaborating with other scholars, and therefore much of my work is collaborative. I suspect that part of the reason for this is that I learn a lot from working with others. Nearly everybody I have worked with, beginning with my graduate school mentors up to my own graduate students today, teach me things and push my thoughts and work in new directions. My Co-PIs and coauthors on this project are no exception, and I am extremely grateful for that.
How Did Hariri Play a Role in the Project?
Hariri was the major catalyst of the project. Mark and I got to know each other through our various roles at Hariri and the Data Science Initiative. Indeed, Mark, Azer and I have been exchanging ideas on computational social science and data science since I arrived at BU. This project seems to be a natural extension of many of those discussions. And, to be sure, this is only one project of many that were launched at Hariri. Thanks to the Institute I have met a number of collaborators across fields, including in engineering, business, computer science, mathematics, and statistics, among others. In short, Hariri has been a central hub in my data science network, and I suspect it will continue to be so for some time.
We wrapped up our meeting, left the coffee shop and started walking down Commonwealth Ave amongst the fast-paced BU students. “I would like to have a web API where any academic researcher could go on any day to query public opinion,” says Christenson. “One could type in their outcome of interest as well as the geographic area of the country and period of time, and in return get estimates of the related public opinion dynamics in real time.”
To read the full article: https://www.bu.edu/research/articles/better-election-predictions/