Junior Faculty Fellow Creates Land Value Map to Improve Conservation Policies
Protecting the environment isn’t cheap, and the success of conservation policies relies on accurate estimates of the value of land. If scientists and lawmakers don’t know how much it costs to conserve private lands, then they cannot enact sufficient policies to protect it. Christoph Nolte, a Junior Faculty Fellow at the Hariri Institute for Computing and an Assistant Professor in Earth & Environment at the BU College of Arts & Sciences, used machine learning to build a map that shows the value of lands across the contiguous United States. His map, recently published in Proceedings of the National Academy of Sciences (PNAS), is more accurate than current methods for assessing conservation costs and could inform future conservation policies.
Early in his career, Nolte realized that he wanted to help protect the environment by providing policymakers with the knowledge they need to improve conservation practices. “It always annoyed me that I could speak about how great the Amazon is and how great threatened species were, but if someone put me in charge of a program I couldn’t answer where the money should go,” he said. Though there are ways to estimate the value of individual properties, they often cannot be easily scaled to estimate the value of millions of properties across the nation. Nolte’s initial inability to explain how to allocate conservation funds on a nationwide scale led him to question how the actual costs of conservation are calculated.
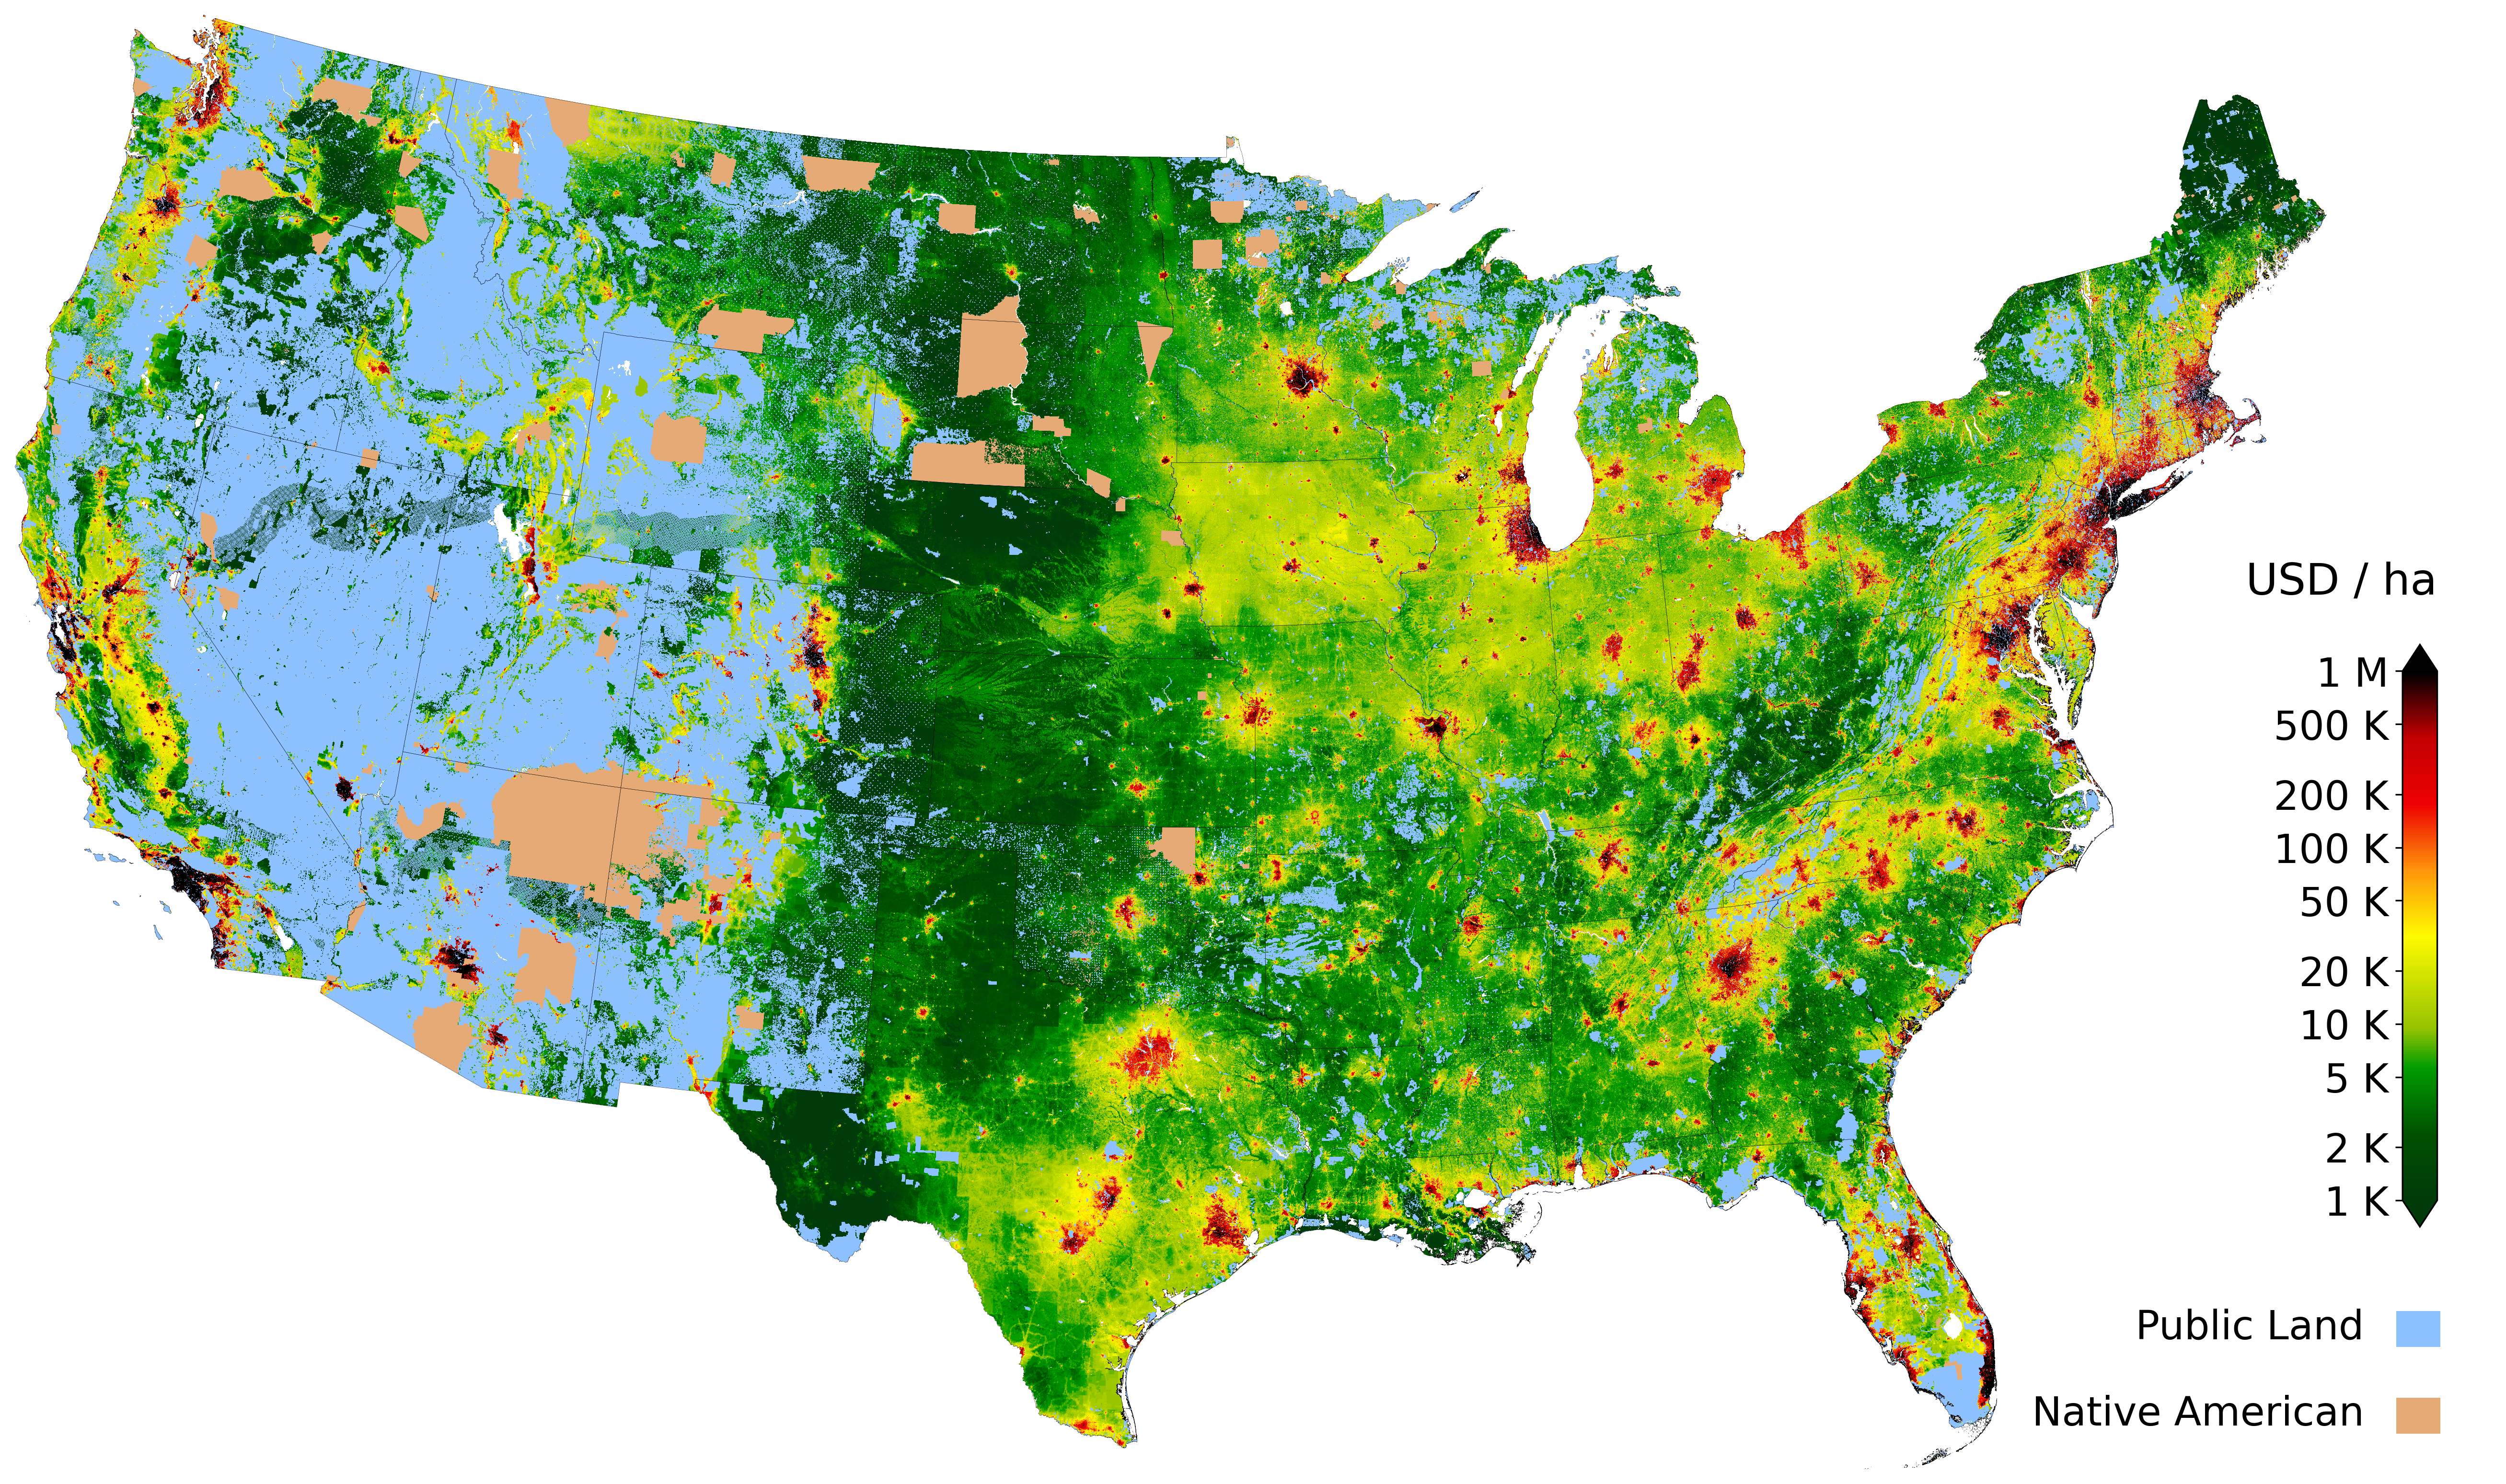
Nolte set out to quantify the private benefits from land, like developing housing, and the private cost of conserving those lands. He built large datasets that included the location and sales prices of individual properties. Nolte also included details like the distance from the land to paved roads, travel times from the land to major cities, and population demographics to make sure that there was enough information to accurately determine the value of the land. Nolte combined the datasets using the Private-Land Conservation Evidence System (PLACES) at the Boston University Shared Computing Cluster.
The resulting map shows some predictable trends — large cities have a lot of value and the value of land decreases further away from city centers. But, Nolte was surprised to see that some lands with the most value weren’t near cities, at all. “As a foreigner, I was fascinated that this data allowed me to obtain this very unique perspective on this country and share that perspective with others,” he said. For example, according to Nolte’s map, Napa and Sonoma counties in California are some of the most expensive “rural” land in the United States. This is likely due to the renowned wineries in these areas, but Nolte wanted to double check.
To make sure that his map was accurate, Nolte compared land values created by his model and those created by other current methods, like property tax assessments, with over 4,000 actual land acquisition prices. Nolte’s map is nearly twice as accurate as other current methods for determining land values. He also found that datasets used in the past to determine conservation costs at large scales, including property tax assessments, underestimated the true cost of conservation in the United States.
Nolte’s map might more accurately depict conservation costs because it takes into account differences in land uses within a county, not just across different counties. Other methods for estimating the value of land don’t use such high-resolution data on a large scale. But, the value of land within a single county can differ drastically. Imagine a county with a big city and a large rural area surrounding it–the price of lands inside and outside of the city would vary wildly. Machine learning allows for scientists to process large amounts of data to take these types of differences into account.
By processing data on such a fine scale, conservationists can more accurately model the costs of conservation nationwide to inform policies. And such modeling could help in predicting how the value of land fluctuates in response to the changing climate. Nolte’s map can help him better understand land values in the United States so he can finally help policymakers figure out how to allocate conservation funds. “We want to know how we can use this data to improve policy models,” he said.
Interested in learning more about the transformational science happening at the Hariri Institute? Sign up for our newsletter here.