The Progress of Public Health.
 Last week coincided with both National Public Health Week and World Health Day, marking it as a time for reflection on the importance of health, locally and globally. Such reflection is, I think, particularly necessary at our present moment, when so much of the news we hear seems to pose challenges for health. I have written previously, for example, of how the Trump administration’s policies threaten to undermine health on a number of fronts, from its rollback of environmental protections, to its broader disinvestment in the structures that promote health in our society. Despite this bad news, it is undeniable that the world is a far healthier place than it once was, and that it continues to become even healthier, in many different ways, as the years go by. With this in mind, we today rerun a prior Dean’s Note on the triumphs of public health, in the hope of maintaining, and accelerating, this momentum towards creating a healthier world, despite setbacks.
At core, compiling a list of public health triumphs is an exercise in values. The Centers for Disease Control and Prevention (CDC) has led the way in the creation of such lists, both for the United States and the global population, reflecting the top ten public health achievements between 2001 and 2010. These lists are based on the nominations of CDC scientists, and I think that they provide a useful perspective on the areas in which experts in the field think we are making the most progress.
One can also look at public health triumphs quantitatively, generating a list based on the top 10 conditions with the largest net reductions in rates of morbidity and/or mortality. Starting from the expert-opinion consensus lists from CDC, we therefore present the top 10 public health achievements between 2001 and 2010, first in the US, and then globally.
Beginning with the US, CDC lists the following achievements: vaccine-preventable diseases (including improved utilization of existing vaccines—i.e. vaccines for hepatitis A and B, and the development of newer ones, such as the inoculation for human papillomavirus), prevention and control of infectious diseases (including tuberculosis and HIV/AIDS), tobacco control, gains in maternal and infant health (including reduction in neural tube defects), motor vehicle safety, cardiovascular disease prevention, occupational safety, cancer prevention (including colorectal, breast, and cervical cancer), childhood lead poisoning prevention, and public health preparedness and response. Of note is that several items on this list, including vaccine-preventable diseases, prevention and control of infectious diseases, motor vehicle safety, declines in deaths from heart disease and stroke, healthier mothers and babies, cardiovascular disease prevention, and occupational safety overlap with CDC’s list of top US public health achievements of the 20th century.
Globally, CDC’s list of the top 10 achievements of the first decade of the 21th century includes: reductions in child mortality (mainly due to infectious diseases), reductions in vaccine-preventable diseases (including measles and polio), access to safe water and sanitation, malaria prevention and control, prevention and control of HIV/AIDS, tuberculosis control, control of neglected tropical diseases (including dracunculiasis [Guinea worm disease], onchocerciasis [river blindness], and lymphatic filariasis), tobacco control, improved global road safety, and improved preparedness and response to global health threats.
To complement this list, we examined the top 40 causes of morbidity and mortality as of 2000, both in the US and globally, taking from each list the top five conditions with the greatest rate decrease between 2000 and 2010. These estimates were derived from the Institute for Health Metrics and Evaluation (IHME) GBD compare visualization page.
The top five causes of mortality in the US with the greatest decrease in rate between 2000 and 2010 were HIV/AIDS (-24.75 percent), road injuries (-19.85 percent), heart disease (including aortic aneurysm [-17.98 percent] and ischemic heart disease [-15.92 percent]), congenital anomalies (-12.4 percent), and lower respiratory infection (-11.55 percent). In Figure 1, we display these gains within the context of a list of the top causes of death in the US, as of 2000, and their relative position in 2010. Additionally, we label with blue text the conditions that made our list with the crude mortality rate per 100,000.
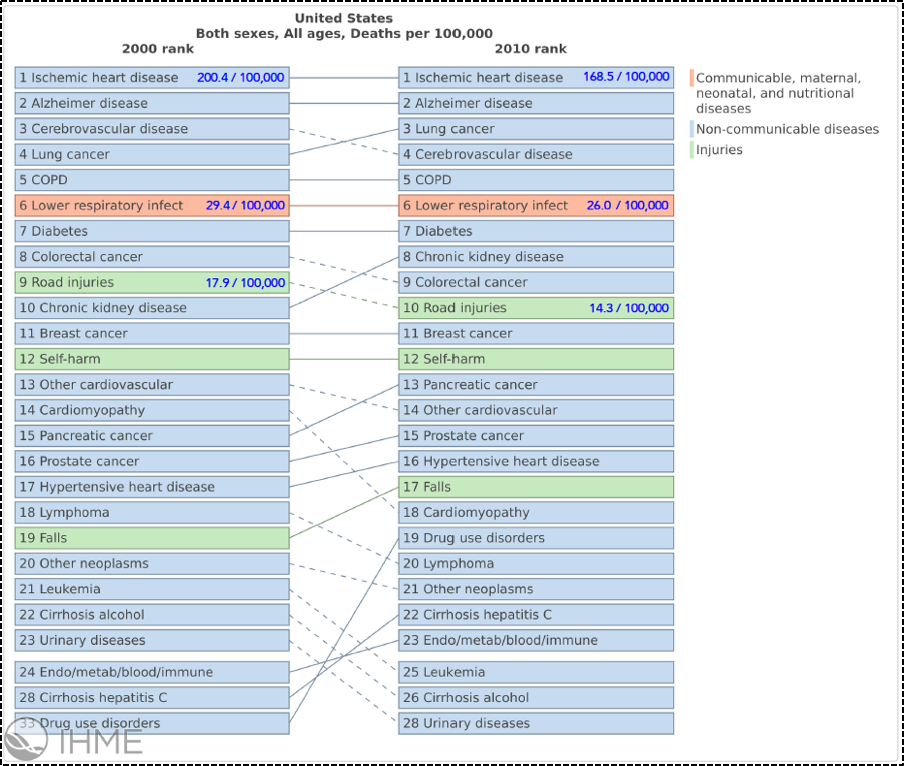
Figure 1.
Top Causes of Death in the United States in 2000 and Their Relative Position in 2010, Annotated with the Crude Mortality Rate per 100,000 for Conditions with the 5 Highest Period Rate Changes; generated using the visualization page on the Institute for Health Evaluation and Metrics website.
The top five causes of global mortality with the greatest decrease in rate between 2000 and 2010 were measles (-80.16 percent), neonatal health outcomes (including neonatal pre-term birth [-37.7 percent] and other neonatal outcomes [-34.83 percent]), diarrheal diseases (-34.8 percent), tuberculosis (-27.3 percent), and drowning (-26.62 percent). We display these gains in Figure 2.
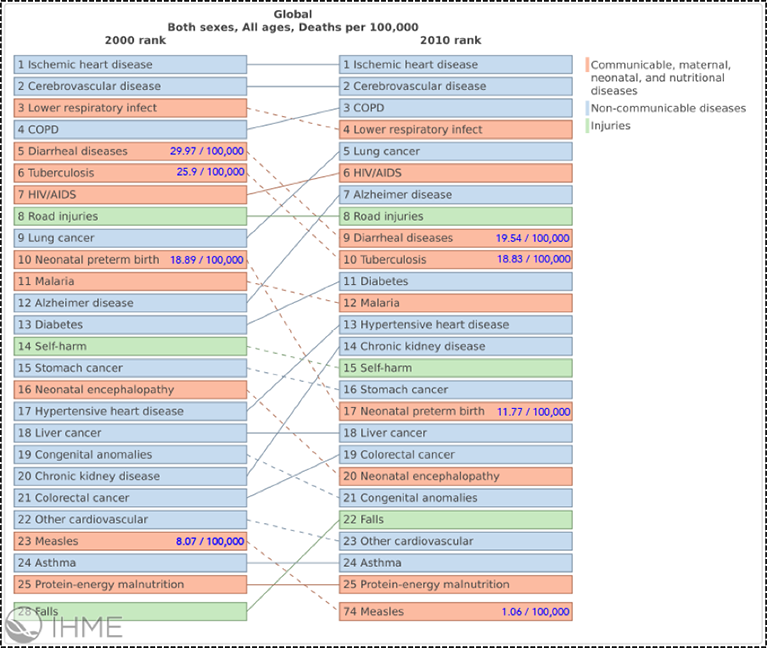
Figure 2.
Top Causes of Death Globally in 2000 and Their Relative Position in 2010, Annotated with the Crude Mortality Rate per 100,000 for Conditions with the 5 Highest Period Rate Changes; generated using the visualization page on the Institute for Health Evaluation and Metrics website.
Therefore, using this approach, the top improvements in morbidity domestically and globally are shown in Figure 3.
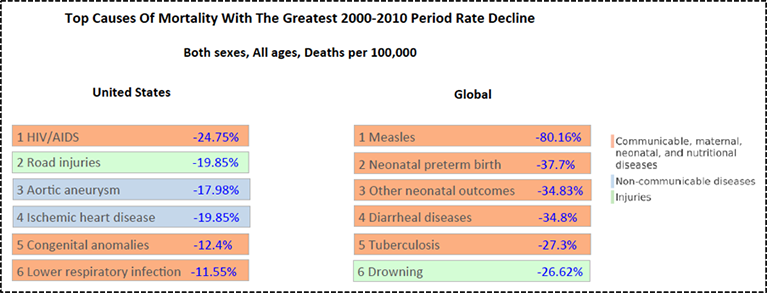
Figure 3.
Top Causes of Mortality with the Greatest Rate Decline in the Period of 2000–2010, Annotated with the Percent Rate Change; rate change figures derived from the Institute for Health Evaluation and Metrics website.
We could also of course measure changes in the burden of disease, not simply mortality, by considering declines in rates of disability adjusted life years.
In the US, the top five causes of morbidity with the greatest decline in the rate of disability adjusted life years between 2000 and 2010 were HIV/AIDS (-28.01 percent), road injuries (-24.25 percent), heart disease (including ischemic heart disease [-15.9 percent] and cardiomyopathy and myocarditis [-11.59 percent]), lower respiratory infection (-12.42), and neonatal preterm birth (-8.04 percent). We display these gains in Figure 4, and label in blue text the conditions on the charts that made our list with the crude rate of DALYs per 100,000.
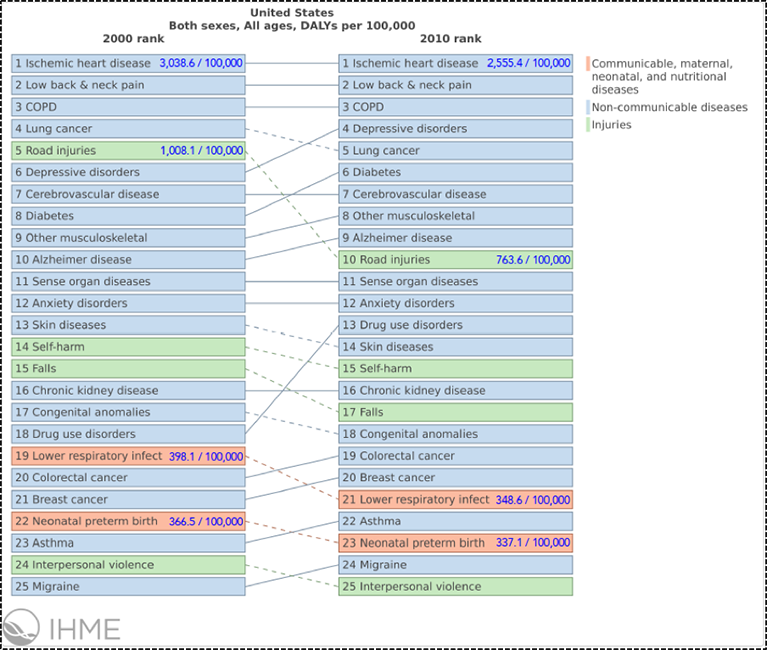
Figure 4.
Top Causes of Disability Adjusted Life Years (DALYs) in the United States in 2000 and Their Relative Position in 2010, Annotated with the Crude DALY Rate Per 100,000 for Conditions with the 5 Highest Period Rate Changes; generated using the visualization page on the Institute for Health Evaluation and Metrics website.
Globally, the top five causes of morbidity with the greatest decline in rate of disability adjusted life years between 2000 and 2010 were measles (-80.47 percent), diarrheal disease (-41.29 percent), neonatal outcomes (including preterm birth [-34.85 percent] and other neonatal outcomes [-32.58 percent]), lower respiratory infection (-33.9 percent), and drowning (-31.71 percent). We display these gains in Figure 5.
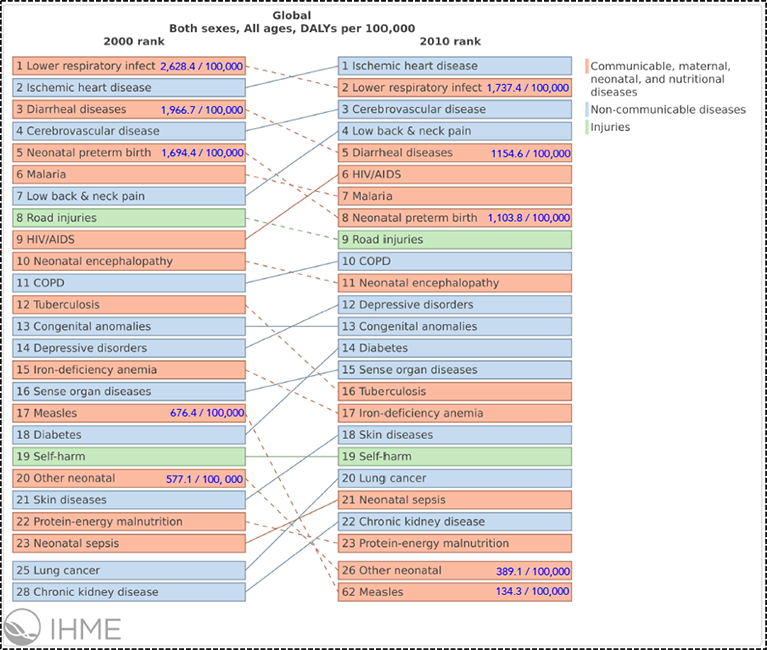
Figure 5.
Top Causes of Disability Adjusted Life Years (DALYs) Globally in 2000 and Their Relative Position in 2010, Annotated with the Crude DALY Rate Per 100,000 for Conditions with the five Highest Period Rate Changes; generated using the visualization page on the Institute for Health Evaluation and Metrics website.
Therefore, using this approach, the top improvements in morbidity domestically and globally are shown in Figure 6.
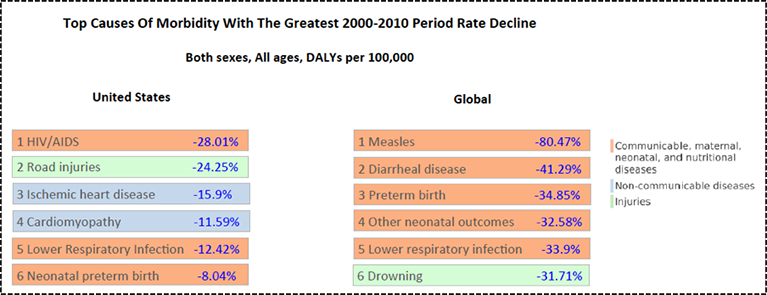
Figure 6.
Top Causes of Disability Adjusted Life Years (DALYs) with the Greatest Rate Decline in the Period of 2000–2010, Annotated with the Percent Rate Change; rate change figures derived from the Institute for Health Evaluation and Metrics website.
Overall, many of the conditions that comprised our empirically constructed lists overlapped with those on CDC’s lists. A striking contrast therefore arises between the predominance of global gains in the areas of communicable and maternal/neonatal diseases, and the more varied distribution of outcomes among top domestic gains. This illustrates the difference between a country that has moved well past the epidemiological transition from major gains in communicable diseases, to increasing gains in non-communicable diseases like heart disease and injury outcomes like road safety.
I hope everyone has a terrific week. Until next week.
Warm regards,
Sandro
Sandro Galea, MD, DrPH
Dean and Robert A. Knox Professor
Boston University School of Public Health
Twitter: @sandrogalea
Acknowledgement: I am most grateful for the contributions of Gregory Cohen, MSW, to this Dean’s Note.
Previous Dean’s Notes are archived at: https://www.bu.edu/sph/tag/deans-note/