Twitter Data Shows Who Is Hitting the Gym.
 Scrolling through Twitter may not be much of a workout, but social media data can tell a lot about how much physical activity different populations are getting, according to a new study led by School of Public Health researchers.
The study, published in BMJ Open Sport & Exercise Medicine, used machine learning to find and comb through exercise-related tweets from across the United States, unpacking regional and gender differences in exercise types and intensity levels. By analyzing the language of the tweets, this method was also able to show how different populations feel about different kinds of exercise.
“In most cases, lower-income communities tend to lack access to resources that encourage a healthy lifestyle,” says study senior author Elaine Nsoesie, assistant professor of global health. “By understanding differences in how people are exercising across different communities, we can design interventions that target the specific needs of those communities.”
In the future, social media and other digital data could help create interventions and policies informed not just by the habits of these communities, but also by what they think of different physical activities, says study lead author Nina Cesare, a postdoctoral associate in global health. “We believe this work provides a step in the right direction.”
The researchers used exercise-related keywords to find relevant, geotagged tweets from around the US from April 2015 to March 2016. After using another set of keywords to clean up the sample (for example, getting rid of references to The Walking Dead or watching sports, or using the expression “running late”), they had 1,382,284 tweets by 481,146 Twitter users in 2,900 US counties.
The researchers estimated the intensity of each physical activity based on how many calories the average American would burn doing that activity for 30 minutes. They used a language processing system that analyzes how “happy” language is to measure the sentiments that Twitter users expressed about exercise. Since most Twitter users don’t include demographic data in their profiles, the researchers used a previously-developed machine-learning system analyzing first names to estimate gender.
Finally, the researchers compared tweets by men and women, and from four different regions of the country: the Northeast, the South, the Midwest, and the West.
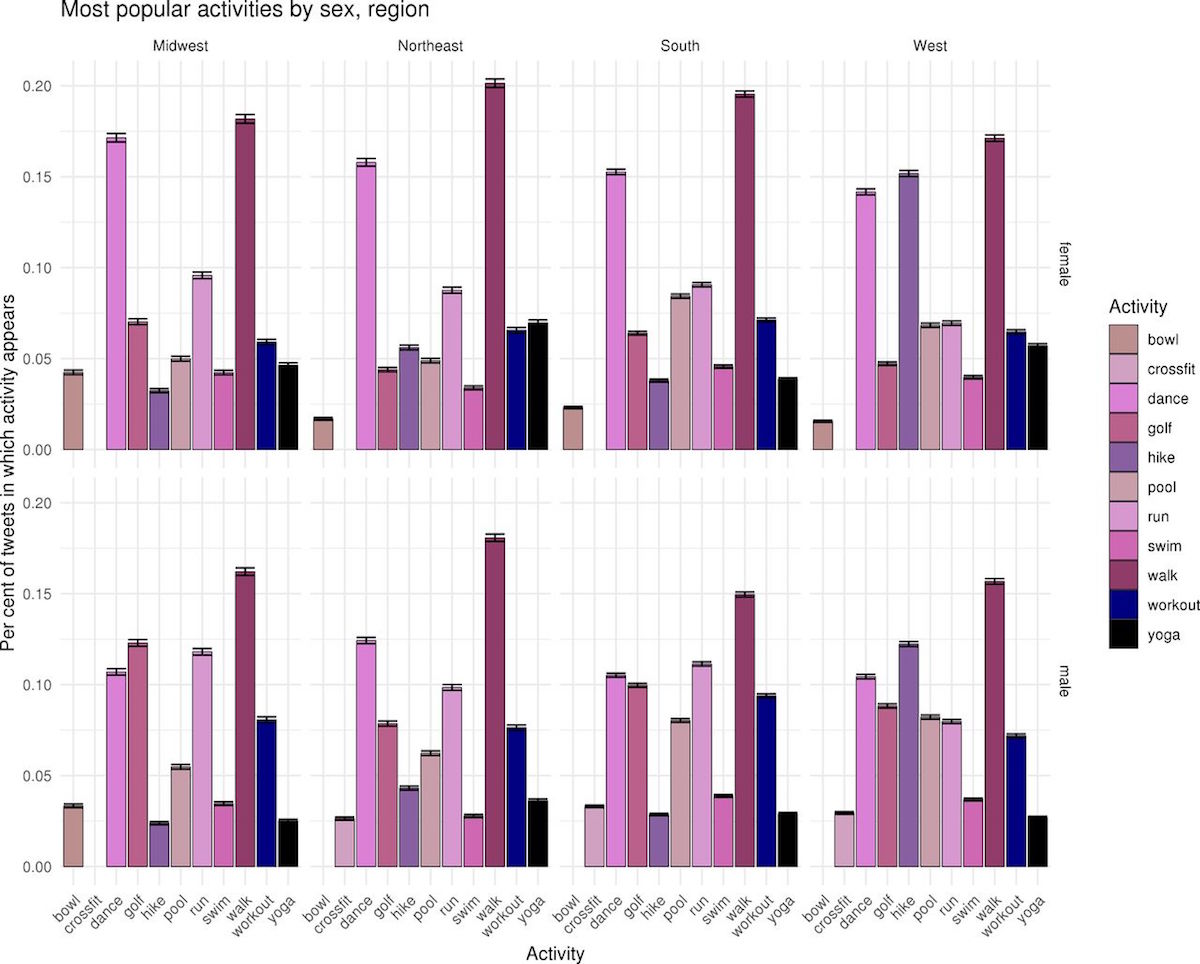
The top exercise terms were “walk,” “dance,” “golf,” “workout,” “run,” “pool,” “hike,” “yoga,” “swim,” and “bowl.” Walking was the most popular activity overall, but other activities varied by gender and region. Hiking was much more popular in the West than elsewhere, and was the second most popular activity among women in that region. Yoga was more popular among women in the Northeast than anywhere else, and golf was more popular among men in the Midwest than in other regions. Although men and women were just as likely to mention gym-based activities, Crossfit was the most popular among men, while yoga was the most popular gym-based activity among women.
Women in the West did more intensive exercise than in any other region, while the Midwest had the most intensive exercise among men. The researchers estimated that men did slightly more intensive exercise than women overall, which agrees with previous research suggesting that women are less likely to get the recommended amount of aerobic physical activity. The South had the biggest gap in exercise intensity between men and women.
The researchers also compared their results with Centers for Disease Control and Prevention (CDC) data on levels of leisure time inactivity in those counties. They found that the counties that were more active according to the CDC were also generally more active according to their Twitter data, and expressed more positive feelings about exercise on Twitter.
The study was co-authored by Quynh Nguyen of the University of Maryland School of Public Health, and Christan Grant of the University of Oklahoma School of Computer Science.