Fueling Up: Mapping China’s Global Power
By Xinyue Ma
As China becomes an active participant in the global power sector, the world is paying increasing attention to Chinese projects overseas. While there has been data and research dedicated to discussing China’s policy bank finance (see for example here and here) and foreign direct investment (FDI) in the energy sector, the “China’s Global Power Database” (CGP) developed by the Global Development Policy Center (GDP Center) is the first database to systematically analyze and compare these two major types of Chinese capital participation in the global power generation sector.
Some of the main findings from the database include:
- Between 2000 and 2018, Chinese companies and policy banks have invested in 777 power plants overseas representing 186.5 gigawatts (GW) of generation capacity across 83 countries in the world. Of this, 106.2GW is already online, which accounts for close to two percent of the world’s total electrical capacity outside China. The remainder is planned or under construction, and represents about one percent of additional capacity needed to meet energy demand by 2030, according to the Stated Policies by country governments of the world.
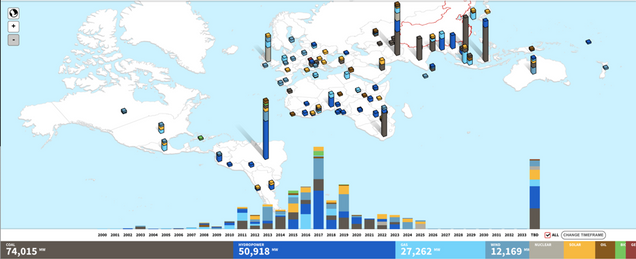
Figure 1: Deal Types of Overseas Power Plants with Chinese Investment and Finance Over Time

- Forty percent of China’s overseas power plant capacity is in the form of coal-fired power plants; 27 percent is hydroelectric, and renewable energy accounted for 11 percent of the total capacity. Annual installation of renewable energy with Chinese investment overseas has generally been on the rise over the past decade, with many projects still under development or planning. However, fossil fuel projects are still taking up a significant share of Chinese overseas power plant capacity.
Figure 2: Distribution of Energy Sources of Overseas Power Plants with Chinese Investment and Finance
- The energy sources of Chinese power generation investment and finance are generally in line with regional energy resource endowments. In addition, host country regulatory strengths seem to be another main factor that attracts Chinese investment and finance in renewable energy. Coal power investment is highly concentrated in Southeast Asia (40 percent), South Asia (31 percent), and Africa (16 percent). These regions also received significant amounts of hydropower investment, but Latin America received the most, at 41 percent of total Chinese hydropower investment. Latin America also stands out as the biggest recipient of other forms of renewable energy, with the largest number of small wind and solar projects. In contrast, the Middle East has only a few large-scale coal, solar, and oil-fired power plants. Chinese investment in Europe and Central Asia, Oceania, North America and East Asia is more focused on natural gas and other non-hydro renewable energy projects, and the scale of installed capacity in these regions is relatively small (Figure 3).
Figure 3: Geographic Distribution of Power Generation of Different Sources with Chinese Investment and Finance Overseas

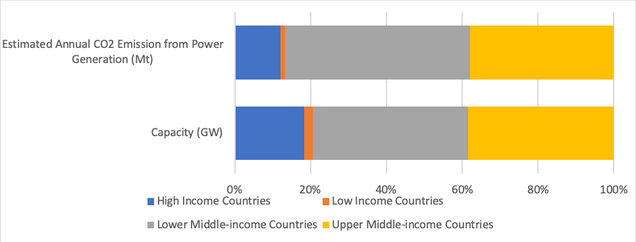
- Chinese investment in lower-middle income (LMCs) and low-income countries (LICs) is crucial for meeting the fast-growing energy needs of these countries. Forty-three percent of Chinese overseas power generation investment and finance went to these countries. According to the International Energy Agency (IEA), LMCs and LICs only received less than 15 percent of global energy investment in 2018, despite containing well over 40 percent of the world’s population. Meanwhile, these investments need to be clean to meet the internationally agreed-upon 2030 Sustainable Development Goals – as Figure 4 shows, Chinese power generation investment in LMCs is more emissions intensive than in the rest of the world, whereas the portfolios in high-income and low-income countries are both cleaner.
Figure 4: Power Generation Capacity and Emissions Estimates in Different Income Group Countries
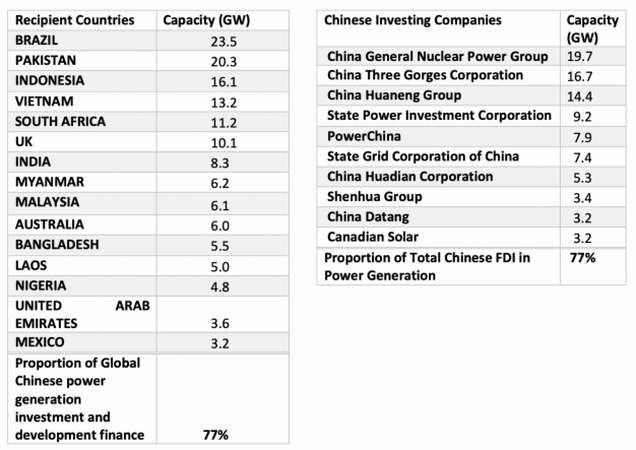
- Even though Chinese power generation investment and finance reaches 83 countries and involves 63 Chinese companies, the top 15 countries with the most power generation capacity represented 77 percent of the total capacity Chinese entities have invested in overseas. Additionally, the top ten investing Chinese companies have contributed to 77 percent of the total capacity of Chinese FDI in power generation.
Table 1: Top 15 Countries with the Most Power Generation Capacity with Chinese Investment and Finance
Table 2: Top Ten Chinese Companies Investing in Power Generation Overseas
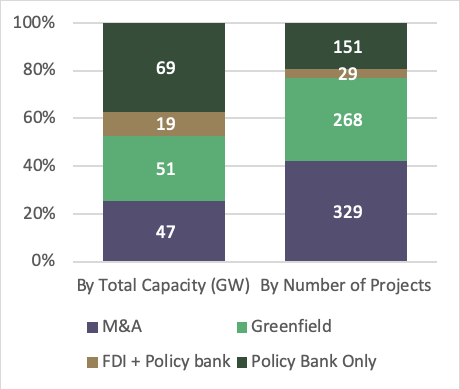
- The CGP Database also shows some differences in the investment behaviors of Chinese FDI and policy banks. For example, Chinese FDI and policy banks have supported similar amounts of power generation capacity overseas. However, policy banks have been investing in much larger projects and many more coal power projects than FDI.
Figure 5: Deal Types of Overseas Power Plants with Chinese Investment and Finance
- Chinese policy banks contributed to 73 percent of overseas coal power generation capacity with Chinese investment and finance, and almost half of the hydropower plant capacity. Meanwhile, the majority of Chinese overseas investment in gas-fired power plants and renewable power generation projects come in the form of FDI.
Figure 6: Fuel Type Distribution of Each Deal Type of Chinese Overseas Power Generation Investment

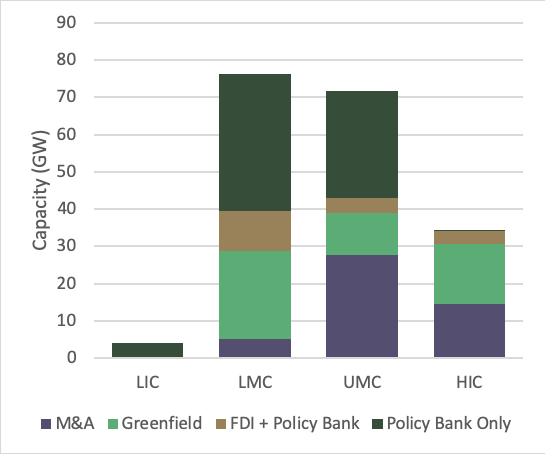
- Additionally, Chinese policy banks are key drivers of Chinese investment in lower income country groups. Almost all Chinese power generation investment in LICs is carried out by Chinese policy banks, which have also supported 62 percent of the capacity invested in LMICs and 46 percent in upper middle-income countries (UMICs).
Figure 7: Deal Types of Chinese Overseas Power Generation Investment and Finance in Different Income Country Groups
- Nine of the top ten investing companies are state-owned enterprises and are also among the biggest power companies in China. These companies also seem to be diversifying their investment portfolios: other than Canadian Solar, the only private company among the top ten which invests solely in solar power, all other top ten companies invest in multiple energy sources and hold at least some investment in renewable power generation. This trend has been growing over recent years.
- A more diverse range of Chinese companies are investing in renewable energy overseas, albeit in small volumes. Thirty-four of the 63 companies, representing 12 percent of the total FDI capacity, are investing purely in renewable energy (including hydropower). Over half of them are private companies.
Even at the global investment level of 2019, the amount and composition of power generation investment is still far behind the annual investment in clean energy needed to hold the increase in the global average temperature to well below two degrees Celsius above pre-industrial levels, including in China, the United States, and the EU. In the current context of the global COVID-19 pandemic, IEA predicts overall power investment around the world is set to decline in 2020 by an estimated ten percent.
The CGP Database shows China’s fossil fuel power plants are currently adding approximately 314 million tons (Mt) of CO2 emissions per year, which is about 3.5 percent of the annual CO2 emissions from the global power sector outside of China. Assuming all fossil fuel projects under construction or planning come online by 2030, they will add another 211 Mt to annual CO2 emissions. Assuming no retirement by 2030, accumulative CO2 emissions from 2018 onward from these fossil fuel power plants will reach approximately 5.9 gigatons, which would consume 1.3 percent of the global carbon budget for a 66 percent chance of limiting global warming to 1.5°C, according to the Intergovernmental Panel on Climate Change (IPCC) Special Report.
Achieving the Sustainable Development Goals requires cutting down existing fossil fuel emissions below the current levels. Any new addition of fossil fuel power generation would jeopardize the progress, and also risks becoming stranded assets, as climate policies strengthen around the world.
Although levels of China’s FDI and overseas contracting and engineering of the first eight months of 2020 has been relatively stable, global power sector investors are faced with unprecedentedly challenging times. Nevertheless, the power sector could be a significant driving force for sustainable economic recovery. Policy support from China, recipient countries, as well as multilateral institutions, will all be crucial to recovery efforts.
In times of economic uncertainty, clear and up-to-date host country policies could be crucial to attracting investments in key sectors, such as power infrastructure and especially for renewable energy in developing countries. Countries could design different types of investment deals according to the market structure and public budget circumstances, and appeal to diverse development institutions for financial support.
As China receives increasing attention in its global engagement, it is particularly important to understand that “Chinese” actors come in various shapes and forms. Different actors play different roles in investment decisions and ownership, with distinct implications for countries’ public balance sheets. The CGP Database enables more nuanced analysis of investment and finance activities with the participation of Chinese actors, and could be used to inform decision making for policy makers, market participants, as well as civil society.