10 Charts for the BRI at 10

By Lucas Engel and Oyintarelado Moses
Ten years have passed since Chinese leader Xi Jinping introduced plans for the Belt and Road Initiative (BRI), a global infrastructure platform to increase connectivity, economic integration, growth and cooperation across the globe.
To mark this anniversary, researchers at Boston University Global Development Policy Center (GDP Center) have synthesized their work on China’s overseas economic activity into a new report that investigates both the benefits and the risks associated with China’s global engagement under the banner of the BRI. While BRI host countries have successfully used Chinese overseas lending and development finance to overcome bottlenecks in hard infrastructure and boost economic growth, many have also experienced the accentuation of existing risks, especially climate risks and debt issues.
Below, see a snapshot of 10 key report findings and broader GDP Center research on the BRI with 10 charts:
Chart 1: China’s Overseas Development Finance, 2008-2021
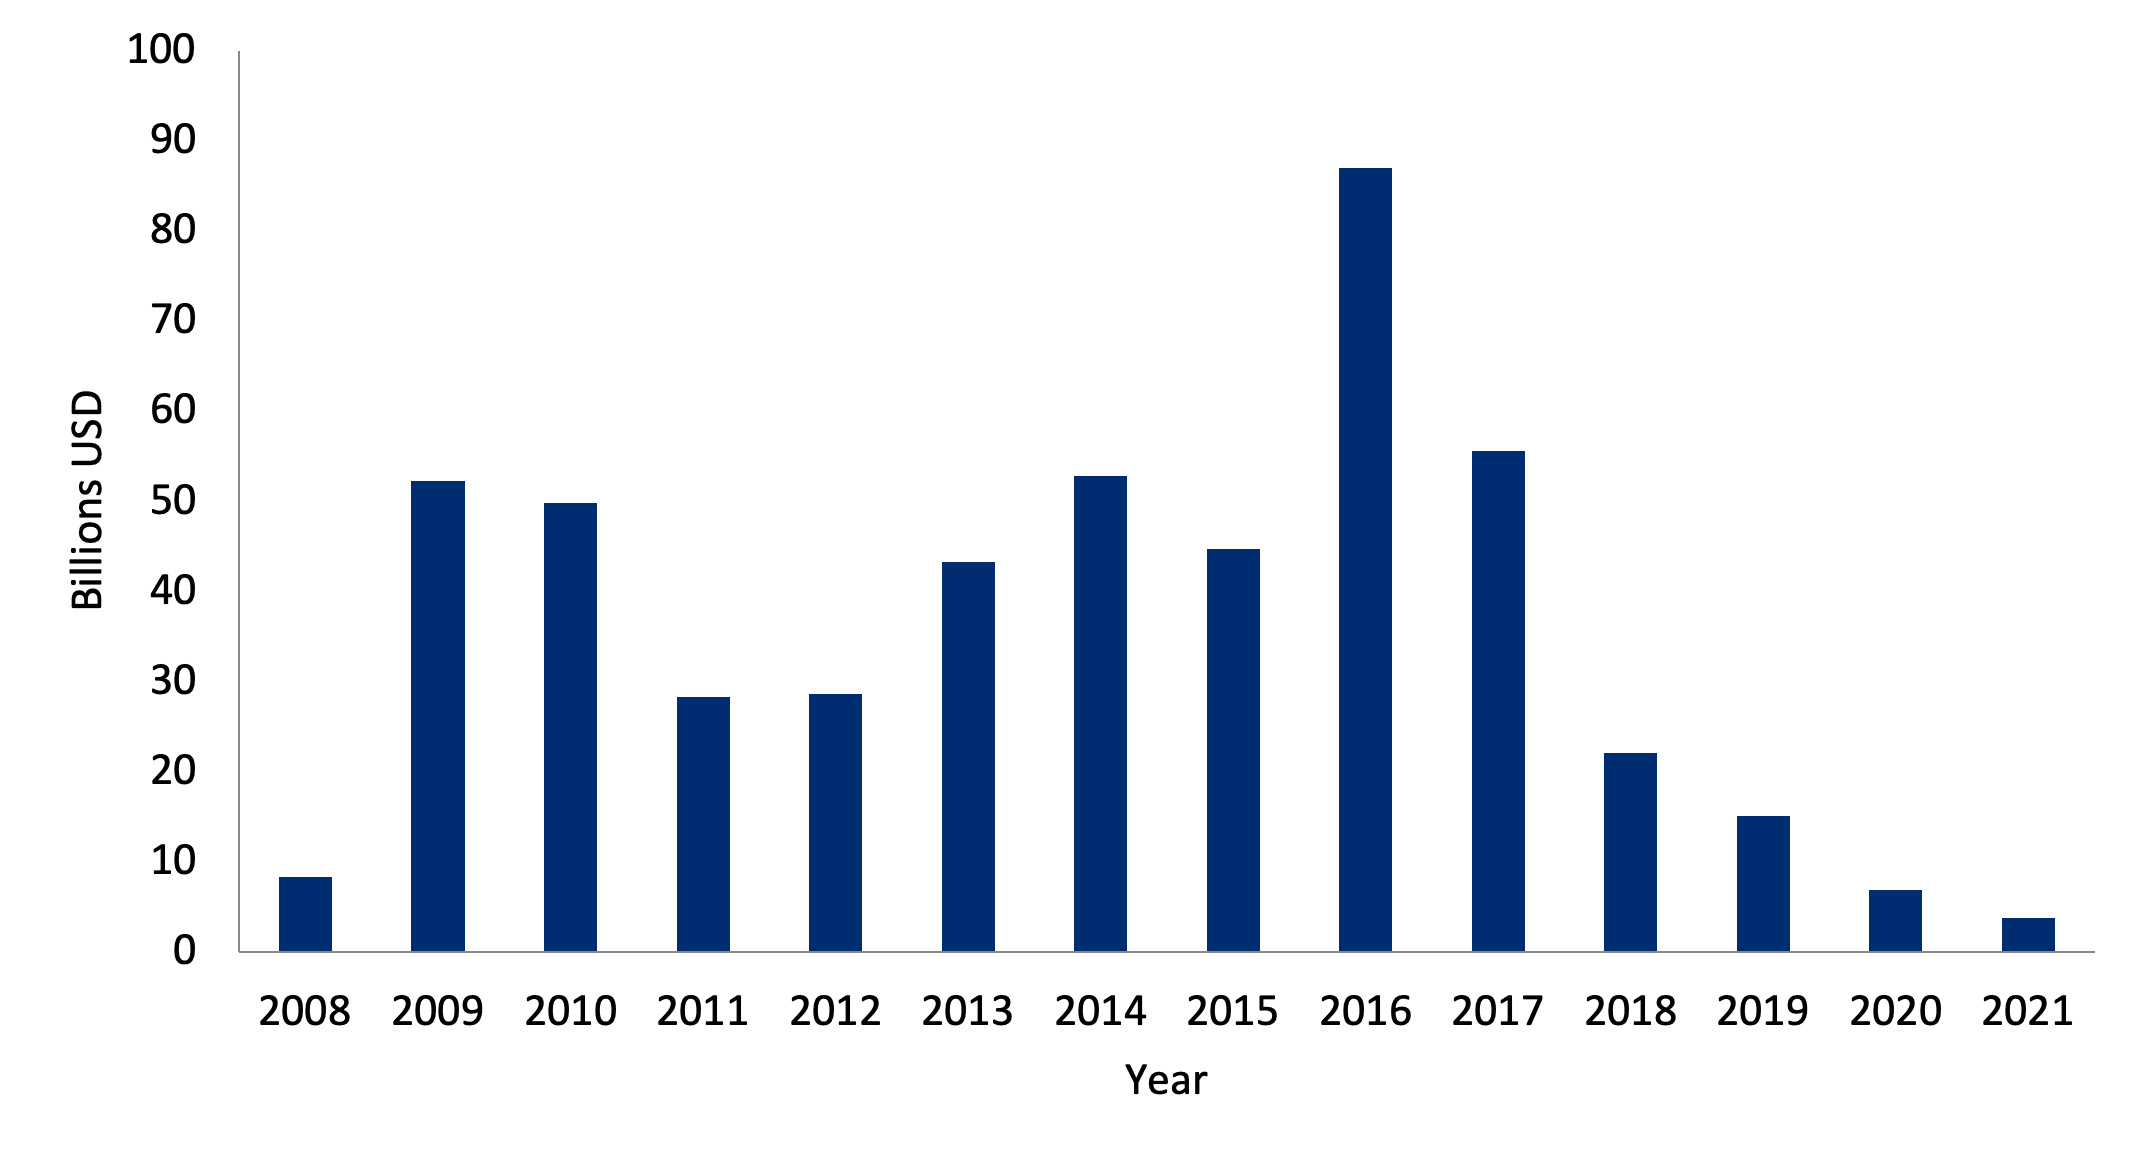
Among the benefits associated with the BRI, is the contribution to the pool of funds available to an international community that needs to mobilize trillions of dollars annually to reach joint development and climate goals. Chart 1 provides a visual depiction of the $498 billion in development finance that China’s two key development finance institutions (DFIs), the China Development Bank (CDB) and Export-Import Bank of China (CHEXIM), have committed to sovereign borrowers across the globe since 2008, of which $331 billion was supplied from 2013-3021, during the BRI era. These funds represent significant support for countries striving to achieve the UN 2030 Sustainable Development Goals (SDGs) and align with the Paris Agreement on Climate Change, ambitions that are projected to cost $2.4 trillion annually and will require around $1 trillion in financing from external sources.
Chart 2: Chinese Loans to Africa, 2008-2021

China’s overseas economic activities have also helped narrow infrastructure gaps in countries and regions that lack sufficient funds for modernizing and expanding transport, communications and energy networks that are essential to economic growth. As shown in Chart 2, Chinese DFIs, commercial lenders and other entities supplied African sovereign borrowers alone with $153 billion between 2008-2021 and $114 billion during BRI years. The vast majority of these funds went toward the construction and modernization of African infrastructure, an essential use of funds considering the African Development Bank’s (AfDB) finding that African countries must mobilize $170 billion per year by 2025 to maintain and construct new infrastructure.
Chart 3: China’s Overseas Development Finance to Latin American and Caribbean Countries, 2005-2022, by Sector
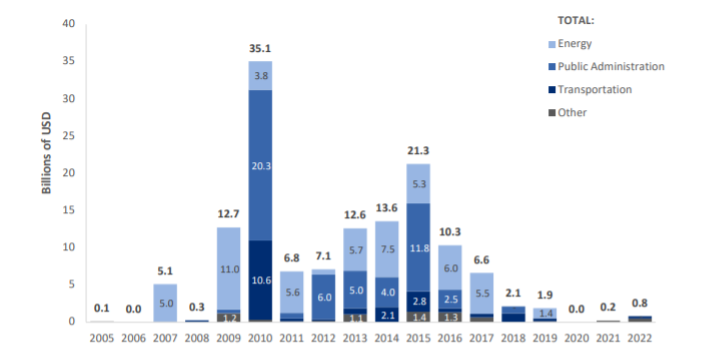
Lending from CDB and CHEXIM to Latin American and Caribbean (LAC) countries totaled approximately $130 billion between 2008-2021, as shown in Chart 3. Though a significant proportion of these flows was directed to public administration, the data from LAC exemplifies China’s tendency to support hard infrastructure sectors like transport and energy.
Chart 4: Sector Distribution of Chinese Overseas Development Finance and World Bank Lending, 2008-2021
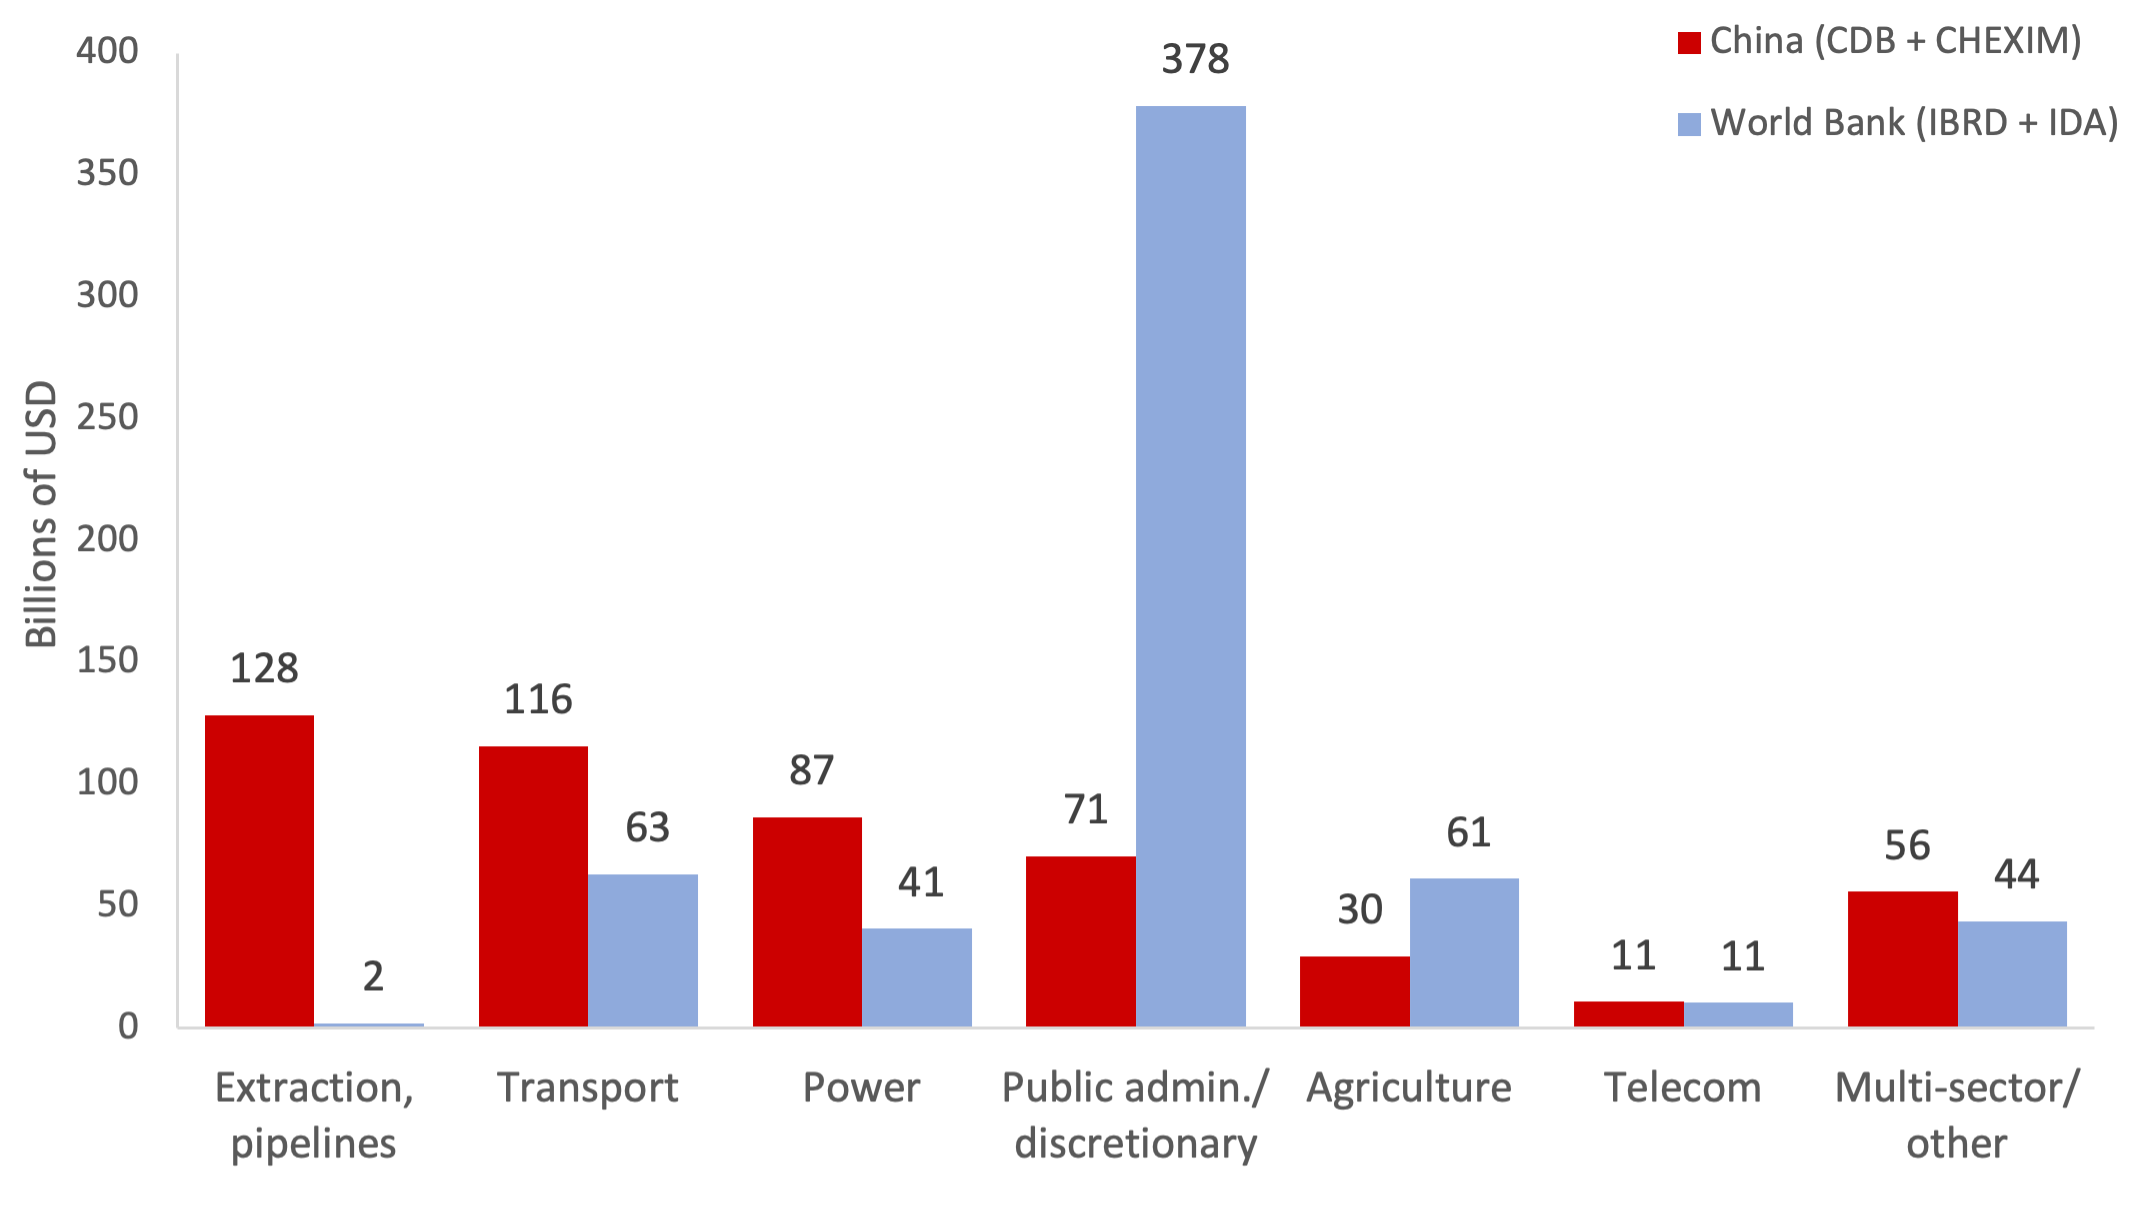
Source: Boston University Global Development Policy Center, 2023.
A comparison between Chinese DFI and World Bank lending serves to illustrate the essential role Chinese lenders are playing in efforts to overcome bottlenecks in hard infrastructure. While multilateral development banks (MDBs), like the World Bank, have allocated more funds to soft infrastructure, Chinese DFIs have largely channeled funds to projects considered hard infrastructure. Chart 4 highlights the contrasting priorities of the World Bank and Chinese DFIs. The majority of World Bank lending between 2008-2021 went toward the public administration sector or was discretionary in nature. China on the other hand, directed financing to transportation, power and minerals extraction industries during the same period. A growing literature establishes a connection between China’s focus on hard infrastructure and economic growth in host countries.
Chart 5: Energy Finance Commitments by Major Development Finance Institutions, 2016-2021

Chart 5 expands the comparison between Chinese DFIs and other lenders to include a number of regional, as well as national, DFIs and focuses specifically on global energy finance spanning the years 2016-2021. Taken together, the amount of loan financing Chinese DFIs provided to energy projects during this period outpaces lending from other DFIs and the World Bank by a considerable margin. GDP Center research also indicates that the decline in Chinese energy lending during this period does not signal Chinese DFIs’ waning interest in energy finance. Rather, the decrease may be attributable to both short term shocks, like the COVID-19 pandemic and a coming transition to greener energy lending.
Chart 6: Country Borrowing from the World Bank and Chinese DFIs, 2008-2021
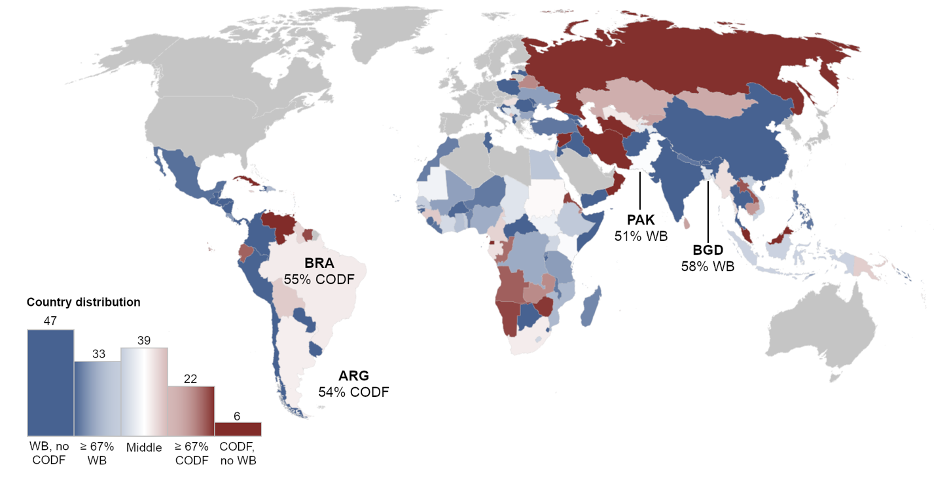
Source: Boston University Global Development Policy Center, 2023.
Chart 6 shows how diverging lending priorities have led borrowers to approach Chinese lenders and traditional DFIs for different purposes, using funds from the former to complement financing from the latter. Of the 100 countries that have borrowed from Chinese DFIs, 72 have borrowed more or equally from the World Bank. Only six countries have opted to borrow solely from China. While Chart 4 illustrates the World Bank and Chinese DFIs diverging specialties, Chart 6 provides an indication of how these varying interests are being utilized by borrowers to satisfy financing needs in different sectors.
Chart 7: China-led Contributions to the Global Financial Safety Net

Apart from the benefits associated with its focus on hard infrastructure, China’s efforts to create alternative forms of liquidity finance have led to a diversification and deepening of the Global Financial Safety Net (GFSN), a collection of institutions and instruments used to avert or end a short-term financial crisis. The GFSN totals approximately $3.5 trillion, with $910 billion of that total provided by China through various institutions and arrangements. Chart 7 shows a breakdown of China’s contribution across a number of these initiatives and agreements. Not only have these new resources added to the available options for countries in crisis, they have also motivated the multilateral system to respond to calls for increased representation of and more voice for China and other developing countries, exemplified by the inclusion of the renminbi into the IMF’s Special Drawing Rights basket and the 2010 quota reform.
Chart 8: EMDE External Public and Publicly-Guaranteed (PPG) Debt by Creditor, 2008-2021
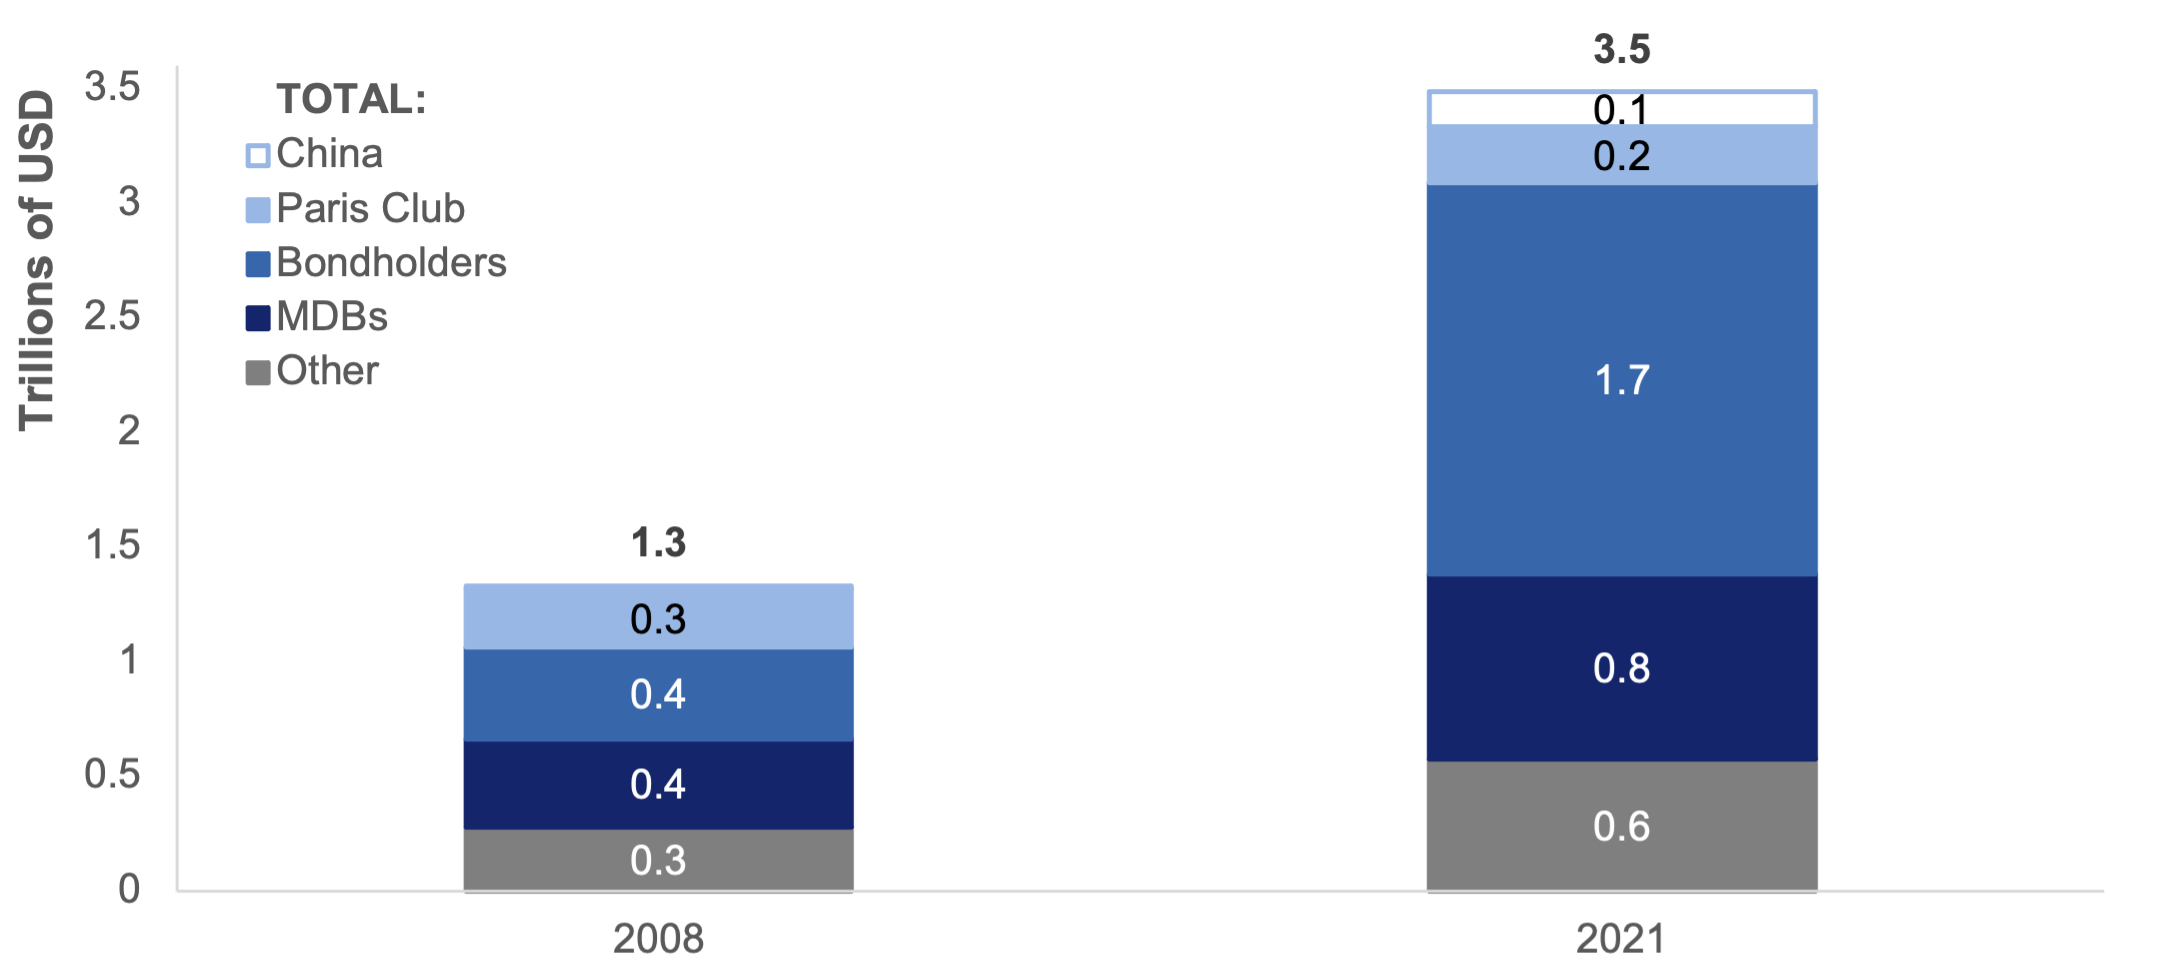
Source: Debt Relief for a Green and Inclusive Recovery Project, 2023.
Among the risks associated with China’s global engagement is the exacerbation of existing debt issues in emerging markets and developing countries (EMDEs). Chinese overseas lending and development finance is associated with debt distress. However, the looming debt crisis in EMDEs is largely an effect of capital outflows triggered by sustained expansionary monetary policy in advanced economies, leading to appreciating exchange rates and enhanced balanced sheets in EMDEs. These trends not only bolstered economic growth in EMDEs, but also led to doubling debt levels since 2008. This debt has become strained under the polycrisis of COVID-19, Russia’s war in Ukraine, climate shocks, inflation and rising interest rates. Chart 8 illustrates how the creditor make-up of public and publicly-guaranteed debt evolved between 2008-2021 and shows China’s part in that breakdown.
Chart 9: Energy Sources for Chinese Financed Power Plants Overseas by Status
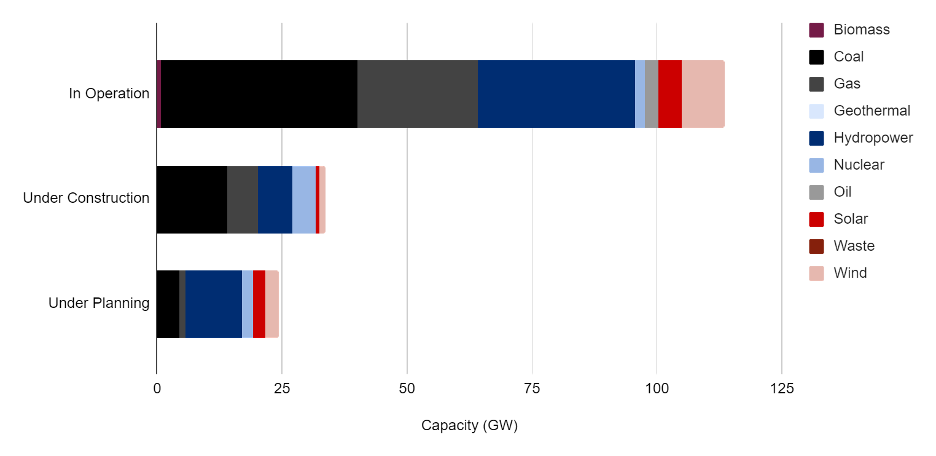
China’s overseas economic activities have also contributed significantly to global greenhouse gas emissions. While China is supporting renewable energy abroad, the vast majority of its energy finance has been directed toward fossil fuel infrastructure. Chart 9 shows that two-thirds of the $235 billion in overseas development finance China committed to energy projects between 2008-2021 was allocated to fossil fuel infrastructure and coal-fired power plants, in particular. Chinese-financed power plants will add approximately 12 gigatons of carbon dioxide to the atmosphere over their lifetime, with 245 million tons added each year.
Chart 10: Risks to Biodiversity and Indigenous Lands from World Bank and Chinese Development Finance

In terms of the wider environmental implications of China’s overseas economic activities, GDP Center research has shown Chinese overseas development finance to be associated with significantly higher risks to biodiversity and Indigenous land than World Bank financing. These risks are not sector specific, but apparent across several sectors, as shown in Chart 10. In part, the higher level of risk associated with Chinese-financed projects is related to China’s status as a relative newcomer in global development finance, as well as immature environmental and social risk management (ESRM) and due diligence policies. Since 2021, China has issued guidelines promoting the development of new ESRM procedures that emphasize the need for more stringent standards, as well as accountability mechanisms. Though voluntary, these guidelines appear to be spilling over into the realm of investment, as evidenced by the China Chamber of Commerce of Metals, Minerals and Chemicals’ (CCCMC) development of its own accountability mechanism in 2022.
As the BRI enters its second decade, it will be essential for China and its partners to cooperate with an eye toward maximizing the benefits and minimizing the risks that characterized the first decade of China’s economic activity under the BRI. GDP Center research has highlighted both the BRI’s success in narrowing infrastructure gaps and fueling growth, as well as the accentuation of environmental and economic risks that have accompanied the Initiative. On the Chinese side, a shift from high volume to high impact engagement in combination with new forms of economic engagement and risk management will be necessary going forward. Host countries for their part, should aim to develop arrangements that help align their priorities with China’s strengths and objectives, while bolstering their own ESRM frameworks and leveraging their strengths to negotiate better deals. China’s outward economic engagement also presents opportunities for cooperation with third parties, though healthy competition should also be expected to deliver desirable outcomes toward the achievement of a sustainable and prosperous future.
Read the Report*
Never miss an update: Subscribe to the Global China Initiative Newsletter.