Uncovering Physical Climate Risks in Overseas Investments

By Xia Li
Physical climate risks, such as wildfire, heat, water stress, excess rainfall, sea level rise, hurricane and typhoons, are having impacts on firms across industries, from business interruptions to increased losses.
California’s largest utility company Pacific Gas and Electric Company filed for bankruptcy protection in 2019 as climate change dramatically increases the risk of wildfire. Some of Russia’s oil and gas fields are at risk from thawing permafrost due to climate change. Heavy rains and floods severely affected a lot of provinces in China in 2020, which is described as the worst within the last two decades. For the first time, the top five global risks identified by the World Economic Forum Global Risks Landscape in 2020 are all related to climate change and environmental issues.
As such, understanding firms’ physical climate risks and how firms respond to climate change is very important. Yet, little is known about impact of physical climate risks on firms. What is the landscape of physical climate risks of firms’ overseas assets? And are there systematic differences between Chinese and non-Chinese overseas assets regarding physical climate risk? If so, what is the key driver?
New research presented as part of the 2020 Global China Research Colloquium provides insights:
First, physical climate risks of firm’s overseas facilities vary by industry. Agriculture sector has high water and heat stresses; mining industry has high floods and sea level rise risks, and wholesale trade has high hurricanes/typhoons exposure.
Second, overseas facilities located in China (including Hong Kong) have high physical climate risks except for heat stress, comparing with that in other countries with high Foreign Direct Investment (FDI) inflow stock.
Third, overseas assets owned by Chinese firms have higher average physical climate risks across countries, with the exception of heat stress, and this driven by the locations of their overseas facilities. However, Chinese overseas assets have lower average physical climate risks within host countries, compared with that of overseas assets owned by non-Chinese firms.
This study uses firm level climate risk data collected from Four Twenty Seven, a provider of data and analysis related to climate and environmental risks. Four Twenty Seven leverages published data and climate modelling to measure the impact of physical climate change on firms and facilities. It considers facilities’ geographic exposure to climate hazards, as well as business sensitivity to those hazards. Different climate indicators are transformed into scores ranging from zero to 100. Around 2,200 public firms are covered in the most updated data, and around 10 percent are China (including Hong Kong) based firms.
Physical climate risks of firms’ overseas facilities vary by industry. Overall, agriculture and mining sectors have high climate risks. Agriculture, forestry, and the fishing sector are more vulnerable to heat stress and water stress. Additionally, agriculture, forestry, fishing and manufacturing sectors are more sensitive to water stress. The mining sector is prone to flood risks, as well as high water stress, and the wholesale trade sector has high hurricanes/typhoons exposure. For sea level rise, the exposure is similar across industries.
Climate risks of overseas facilities vary by host country. Figure 1 presents the average climate risk scores of overseas assets located in the 10 host countries with highest foreign direct investment (FDI) inflow stock. The figure shows that overall facilities in China and Hong Kong have high climate risks. Specifically, facilities located in Brazil have high heat stress risks; facilities in mainland China have high water stress and floods risk, and facilities in Hong Kong have high hurricanes and sea level rise risks.
Figure 1. Average Climate Risk Score by Host Country – Overseas Facilities
(Top 10 Countries with Highest FDI Inflow Stock)
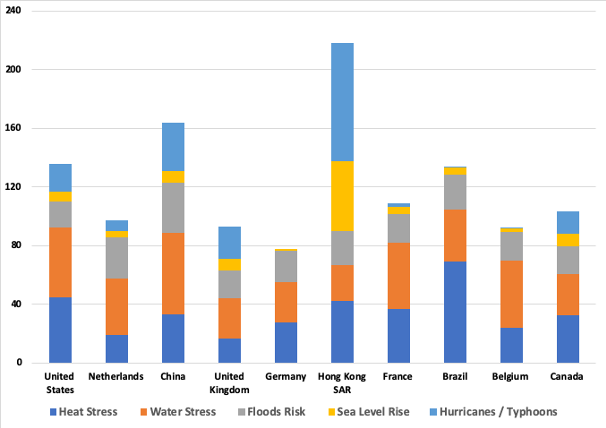
Source: Analysis based on Four Twenty Seven physical climate risk data. FDI inflow is based on the World Bank data.
Climate risks of overseas facilities also vary by firms’ headquarters countries. Figure 2 presents the climate risks of overseas assets owned by firms in countries with highest FDI outflow stock. Heat stress exposure is similar across firms headquartered in different countries, with facilities owned by Canadian firms have slightly higher risks. Overseas facilities owned by mainland Chinese firms have high water stress and floods risks, while facilities owned by Hong Kong firms have high hurricanes and sea level rise risks.
Figure 2. Average Climate Risk Score by Headquarters Country – Overseas Facilities
(Top 10 Countries with Highest FDI Outflow Stock)
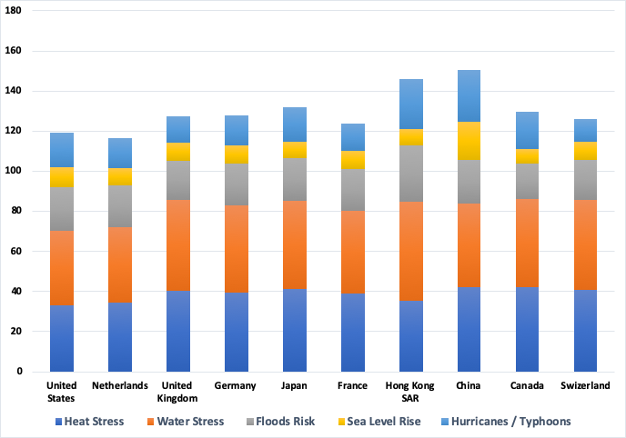
Source: Analysis based on Four Twenty Seven physical climate risk data. FDI outflow is based on the World Bank data.
It appears overseas facilities owned by Chinese firms have high physical climate risks. But are these differences statistically significant? Is the risk driven by the industry differences, or by certain specific countries with high climate risks? What about by some specific firm characteristics?
Cross sectional regressions at the level of firm-industry-country were run to examine: 1) whether Chinese overseas facilities have different climate risks within industry, but across host countries; and 2) whether Chinese overseas facilities have different climate risks within industry and within host countries.
The regression analysis results suggest Chinese overseas assets have higher climate risks across countries except for heat stress, comparing with overseas assets owned by non-Chinese firms. The difference is economically and statistically significant, and the difference is particularly large for hurricanes/typhoons risk.
However, except for heat stress, Chinese overseas assets have lower average physical climate risks within host countries, compared with overseas assets owned by non-Chinese firms. It implies the higher climate risks of Chinese assets across countries is driven by the locations of Chinese overseas assets. In other words, Chinese overseas facilities are located in countries of higher climate risks.
In addition, the climate risks of overseas assets in countries participating in Belt and Road Initiative (BRI) were compared with those in non-BRI countries. Of the 2,200 public firms covered in Four Twenty Seven data, around a quarter of overseas facilities are located in BRI countries, with 76 percent of Chinese overseas assets are located in BRI countries. Physical climate risks of overseas facilities in BRI countries are significantly higher, with the exception of hurricanes and typhoons exposure.
These findings provide insight on firms’ physical climate risks by industry and country, and may aid policymakers in setting up effective climate change adaptations policies or guidelines.
A couple of international finance intuitions have started to take climate risks into consideration. For instance, the 2020 version of Equator Principle has incorporated climate risk assessment, including transitional and physical climate risks[5]. Green Investment Principles for the Belt and Road[6] initiated by the Green Finance Committee of China Society for Finance and Banking and the City of London Corporation also calls for climate-resilient infrastructure and encourages projects to disclose climate risks under the Task Force on Climate-related Financial Disclosures guidelines.
Future research will collect panel data of firms’ overseas projects in the power sector and examine the extent to which climate risk may be a factor in firm location choice.
To stay up to date and receive email updates of publications from our Global China Initiative, subscribe to our newsletter.