Google Analytics’ Users Flow data gives you greater detail on how visitors interact with your website during their visits. It provides you with the relative volume of traffic to your site by the dimension you choose (e,g., traffic sources, campaign, browser), and allows you to see how visitors navigate your site from page to page.
How can I see Users Flow data?
- Once you have set up Google Analytics, you can access Users Flow data by logging into the Google Analytics homepage. You can get to this homepage directly or via the Google Analytics widget on the dashboard on your WordPress site. If you have this widget, you can click “View all data” in it and then log into your Google Analytics account.
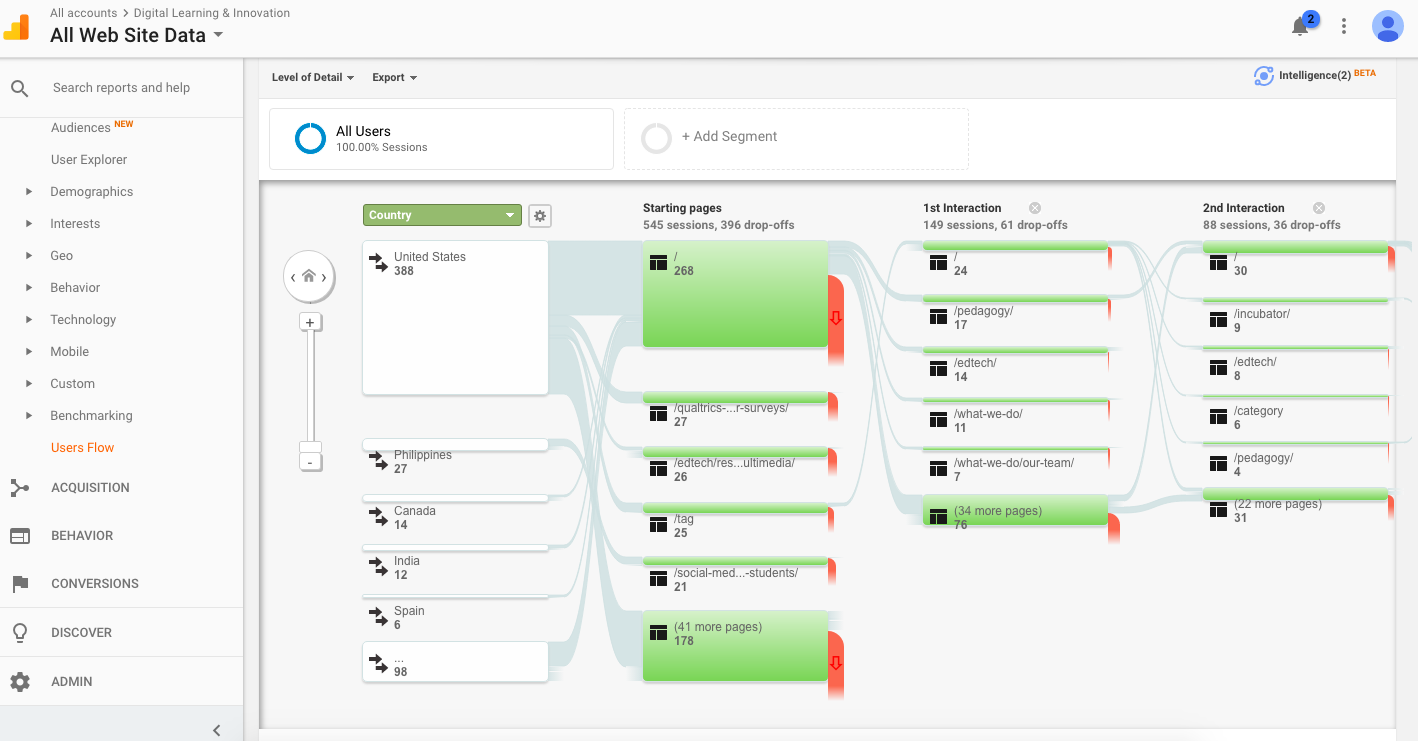
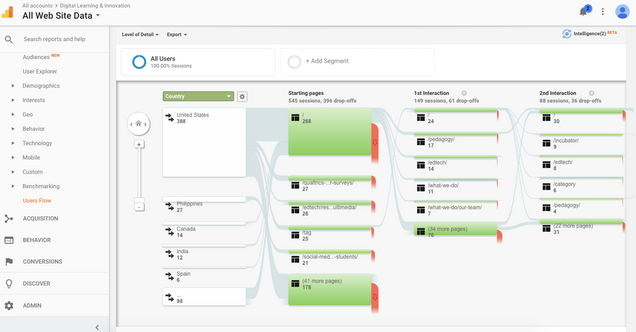
- On the left-hand side of the Google Analytics page, go to Audience>Users Flow to access the data.
- You will see a chart showing visitors’ interaction with your WordPress site. The Starting pages are visitors’ first stops during their visit to your website. The first interaction is the next page they visit within your site; and so on for the second and other interactions.
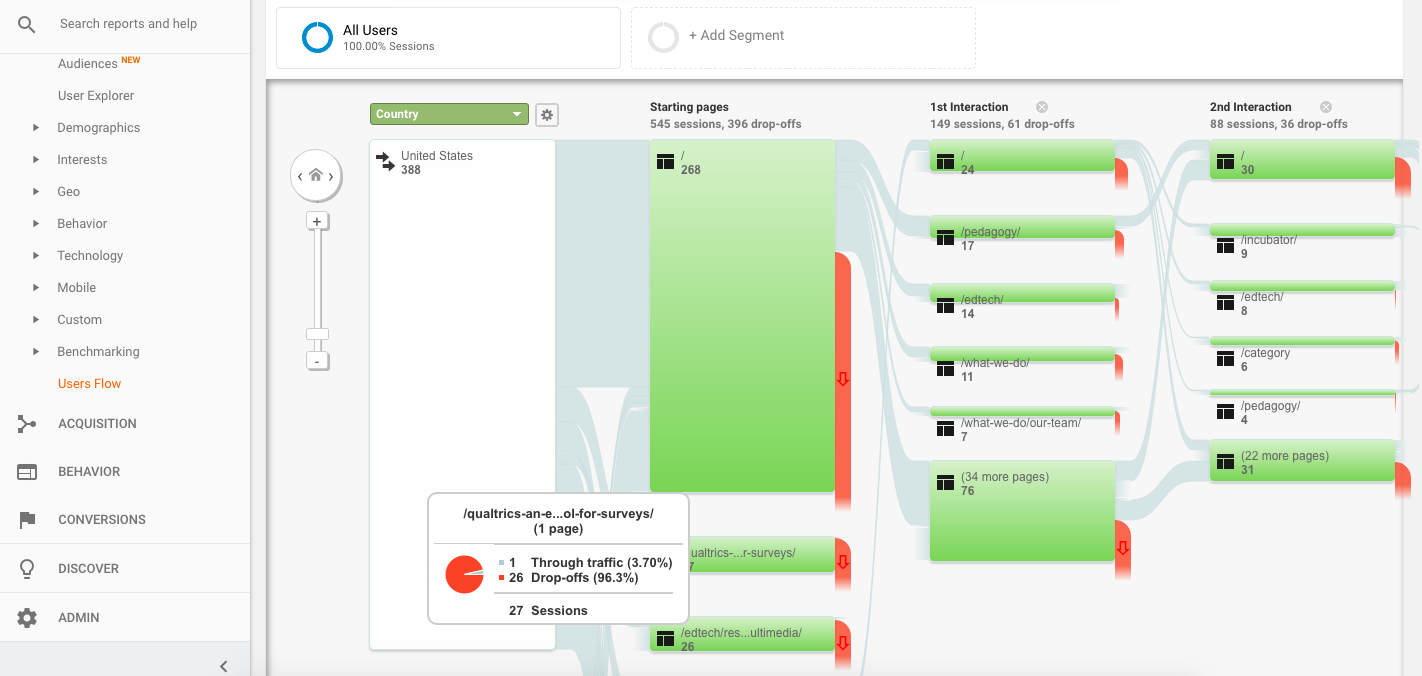
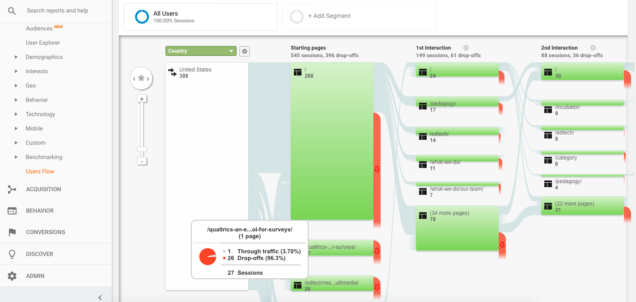
- Drag or zoom out the chart to see data of more interactions.
- Move to each box to see more detailed data.
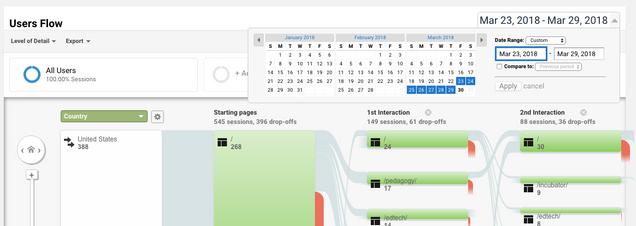
- You can check the relative volume of visits to your site in a specific period of time by choosing the time period at the upper right corner.
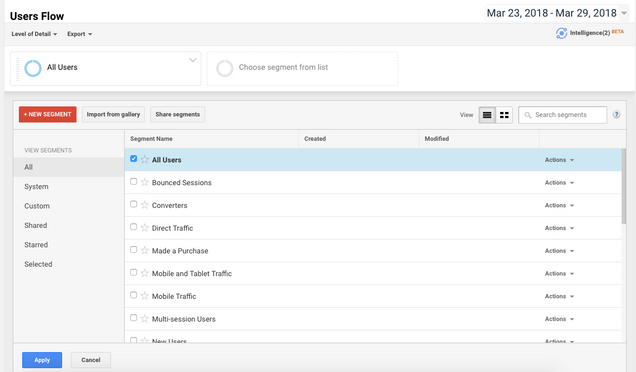
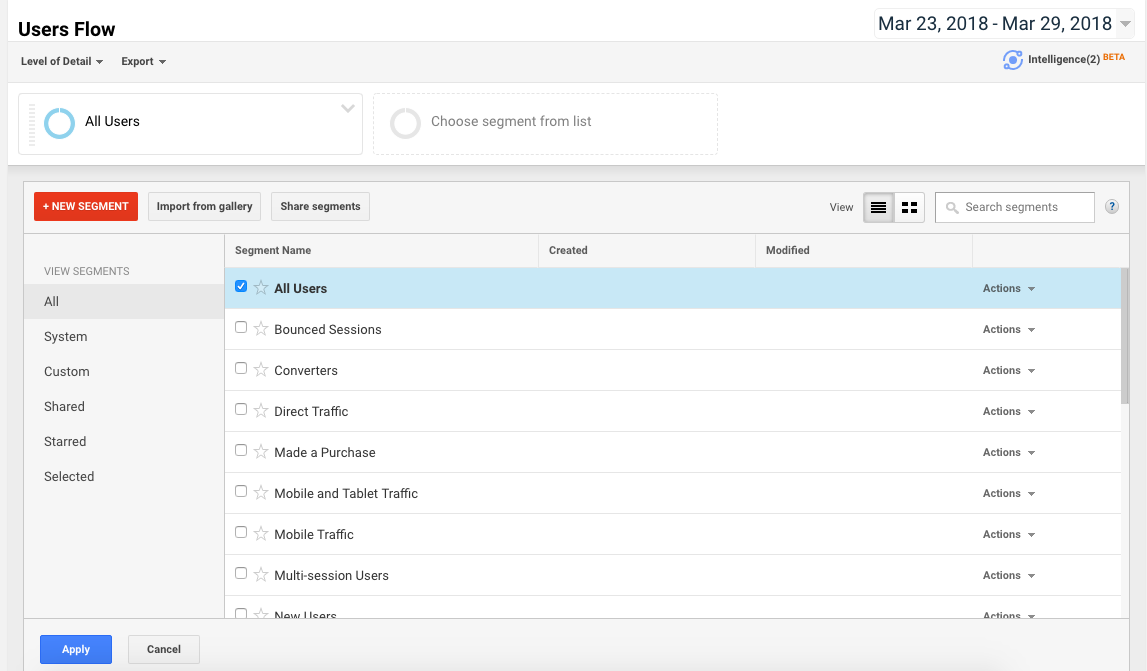
- Add filters to the data to see the report for a specific group. Click “Add Segments” beside “all users”. Then, choose the segments you would like to look at and click “Apply”.