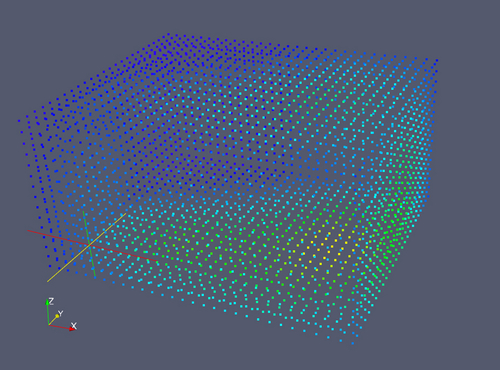
Here we represent every data point by a small object in space, pseudo-colored by the data value.
This first example shows a sphere at every point in the data set. Notice the Moire-like patterns.
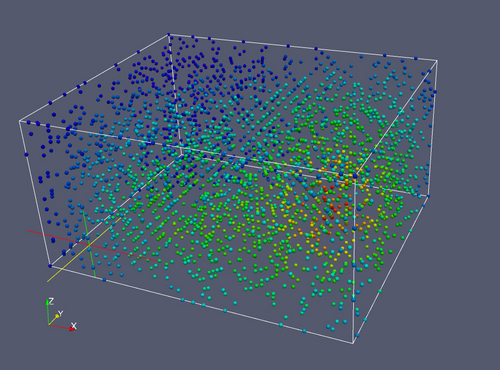
Showing a smaller set of points at random locations, using interpolation for the data value, eliminates this pattern.
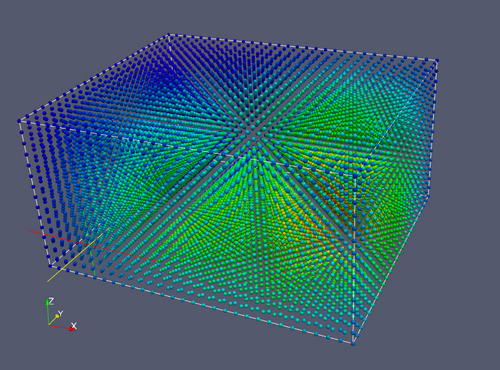
Although this has limited applications, an alternative is to use a regular pattern, but only show the boundaries of the domain. In this image the glyphs are “points”, essentially small disks in the view plane, rather than spheres in space.