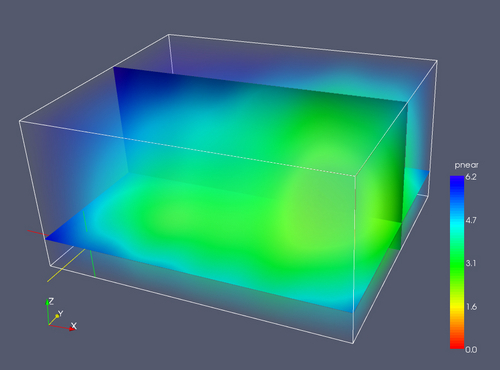
Here we think of the domain of the function as being a volume of a translucent material. We can control the opacity and color of the material, to “see through” some areas and make others “solid”.
A volume visualization of the data set, using the same color map, with the opacity adjusted to allow seeing through the areas surrounding the “central” area of interest. We don’t see the central point as red, because we are viewing it through green “fog”.
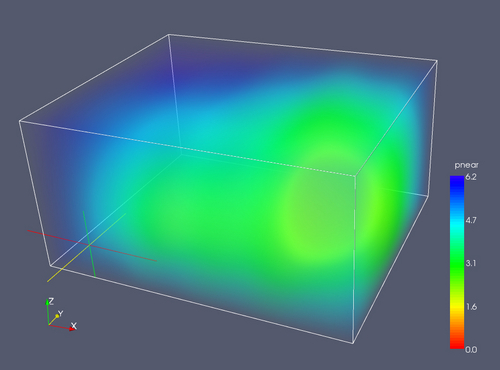
A volume visualization of the data set, combined with the two slice planes we used earlier. The planes not only add information but help the viewer to “read” the spatial relations.