Infographics and Visualizations from the US Census
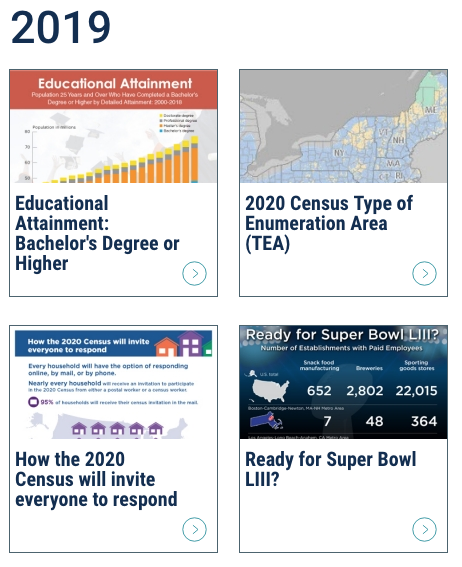
The US Census Bureau has made several infographics and visualizations available on their website. Visitors are able to quickly scan the page for ready-made visualizations by year, such as Educational Attainment: Bachelor’s Degree or Higher and also see popular features, such as their Interactive Maps. The Population Bracketology visualization can be used as a game that tests knowledge of population across the United States. The site may be helpful for teachers looking to engage students in discussions of American history, population movements across time, and other related topics.
You can find the Census Data site, and many more sources like it, highlighted within our education research guides under the Data Sources menu option on each guide. The guides also feature sections on finding background information, writing and citing, finding ebooks, key journals, and databases appropriate for educational research and practicing teachers.