Data Visualizations from the US Census
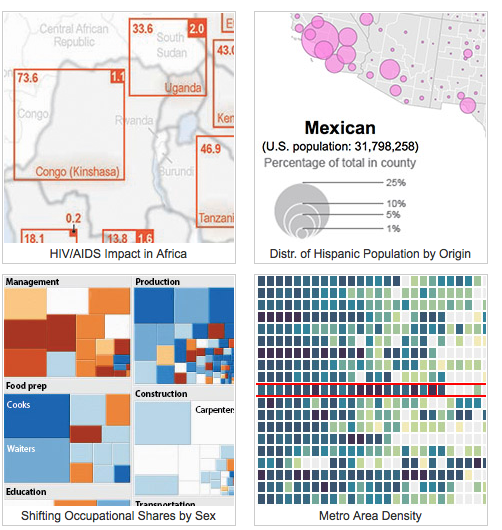
The US Census Bureau has made several data visualizations available on their website. Visitors will be able to quickly scan the page for ready-made visualizations such as Differential City Growth Patterns and Without a High School Education. The Population Bracketology visualization can be used as a game that tests knowledge of population data across the United States. The site may be helpful for teachers looking to engage students in discussions of American history, population movements across time, and statistics on diversity.
You can find this site and many more highlighted on our Resources for Teachers research guide. That guide contains mostly free websites, but also features print books and electronic databases appropriate for Language Arts, History, Mathematics, and Science and Engineering teachers, as well as some general resources for all teachers.