Sports Is Now Science. How Did That Happen?
Real-time data tells coaches which plays work, and which athletes are working
A generation ago, the internet changed everything. Today, data science is proving just as revolutionary. Fueled by the abundance of personal information on the internet—yours, ours, everyone’s—data science is making business smarter, healthcare more efficient, technology easier, and sports more fun to watch (and play). But it’s also made all of us more vulnerable. This article, the third in a five-story series, comes as Boston University is investing aggressively in the world of big data and is poised to build a 17-story Data Sciences Center on Commonwealth Avenue that will house its mathematics and statistics and computer science departments. As BU President Robert A. Brown said: “This is the science that’s going to change the way we behave, driving our behavior for the next 50 or 100 years.”
Competitive sports has always been about metrics. Winners ran so many seconds faster than losers, or lifted so much more weight, or scored so many more goals, or runs, or points. But as the 20th century came to a close, sports metrics entered another dimension.
Baseball was the first sport to go under the microscope. Instead of estimating a baseball player’s worth by looking at his batting average or number of home runs, the new school of scouts started looking at on-base percentages, meaning how often a player got on base, by any means.
This new, more empirical analysis of baseball—called sabermetrics—and its clash with traditional player assessment provide the drama in Moneyball: The Art of Winning an Unfair Game, Michael Lewis’ 2003 book about the Oakland Athletics’ statistics-driven approach to building a baseball team. That approach led the previously beleaguered A’s to 20 consecutive wins and reinvented the way every baseball team approached the game.
But it would also not entirely be an understatement to say that the data-first approach those Oakland A’s took reinvented a lot more than baseball—that approach reinvented the entire sports universe as we know it. Today it’s computing power and programming skills that are used to attach value to just about every aspect of any game—a particular play, a combination of athletes, the number of seconds it takes an athlete to go from 0 to 11 miles per hour. Sports is now science.

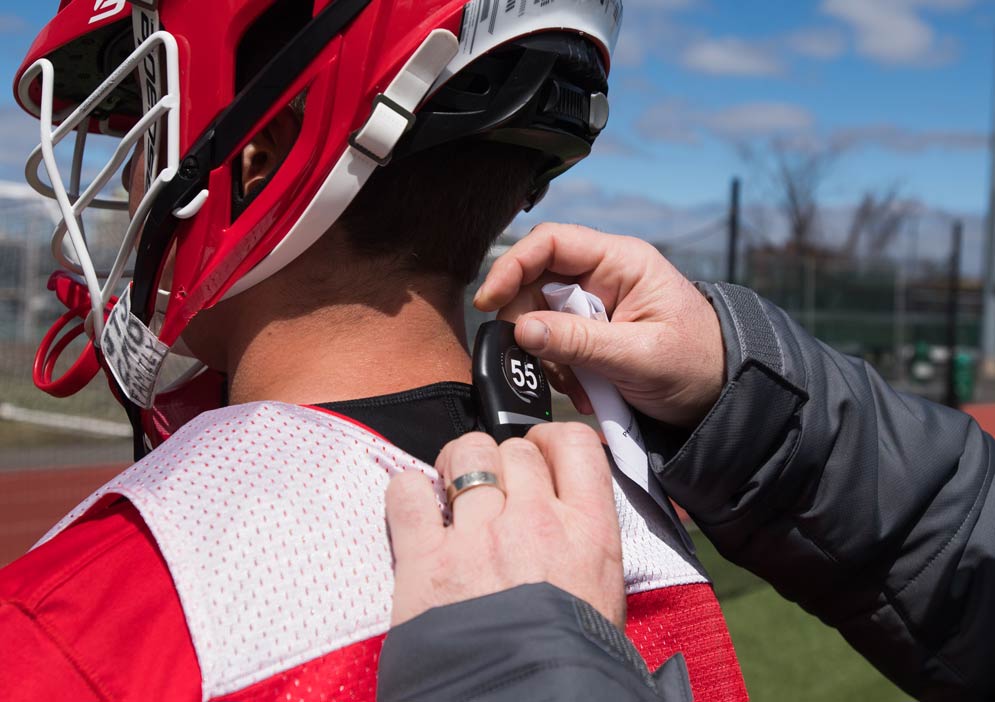
Software platforms use GPS to pinpoint the field position of every athlete at every moment of a soccer game, or a lacrosse game, or a basketball game, and wearable devices report in real time the heart rate of hockey players when they’re on the ice, as well as how long it takes their heartbeat to return to its normal resting heart rate when they come off the ice.
At BU, the men’s hockey, men’s lacrosse, and women’s field hockey teams follow those biometrics with an off-the-shelf platform called Catapult, which tracks field position with GPS, and biometrics with wearable devices. Catapult’s website claims that its software is used by more than 1,500 teams, including the Boston Celtics and Boston Bruins, and that its cloud-based analytics can maximize more than 1,000 data points per second from each athlete. Even with those capabilities, the platform has some competition. BU’s women’s soccer uses a system called Polar, which also tracks both field position and heart rate, and other BU teams use Firstbeat, which tracks only heart rate.
Ryan Polley, men’s lacrosse head coach, signed on to Catapult’s service this year, impressed with its ability to report every athlete’s field position, running speeds, and acceleration and deceleration. Polley says the metric that he finds most meaningful is “player load,” a combination of speed and acceleration that translates to something most people would call “intensity.”
Glenn Harris, BU head strength and conditioning coach, attends every lacrosse practice, where he looks at data in real time and later sends a report to the coaching staff with information showing a player’s load for the session.
“A couple of people have said to me, ‘This is coming down to science,’” says Harris, who supervises all strength and conditioning programs for the Terriers’ 24 varsity teams. “I said, ‘Yes, that’s exactly what it is.’ Without it, you might look at a practice and it might seem hard or easy. The data we get will validate what we see.”
Harris says he pays close attention to indicators of intensity, such as how much distance a player covers running at high speeds and how many high-intensity efforts occur. “We look at that data and we work backwards,” he says. “We try to design a practice that puts players in the best possible position to be fresh for the next game.”
Tracey Paul, assistant coach of field hockey, recently subscribed to a version of Catapult that provides a sports scientist to help interpret the data. Previously, she says, the team used software that only collected heart-rate biometrics from practices and games. “That gave us basic insight into performance and recovery,” she says. “And even with those systems, we noted a huge decrease in soft muscle tissue injuries. Now with the Catapult X4 system, we get so many more metrics to provide insight into individual and team performance. We can also analyze the intensity of drills, and design practices to meet predetermined metrics for where we are in the week pregame.”
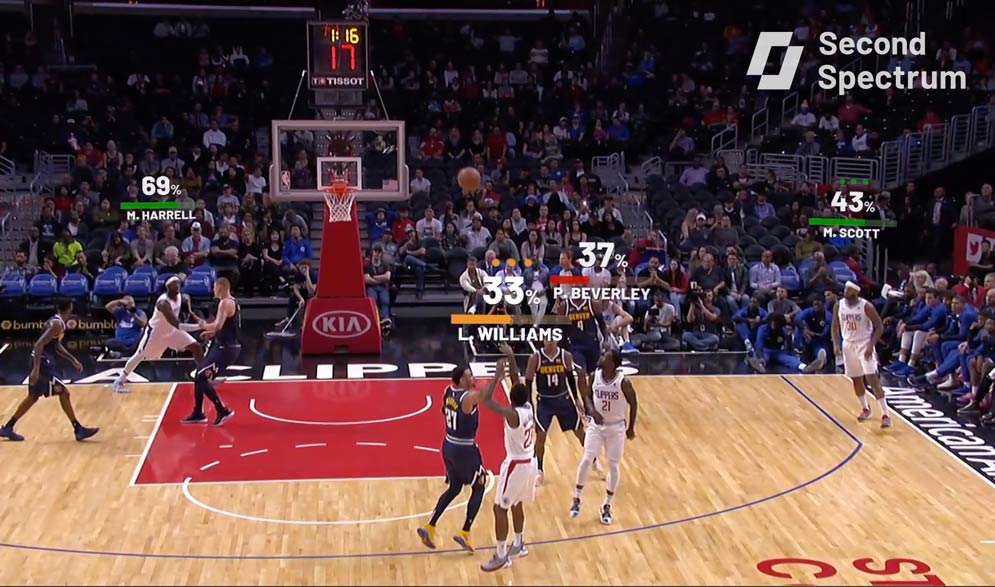
The new appreciation for sports analytics has created some unanticipated jobs for analytics experts. Three years ago, Grant Fiddyment (MED’16) was using statistical models to study complex networks and brain dynamics at the School of Medicine. Now, in addition to teaching predictive analytics at American University, he works as a data scientist with the 10-person, $3-million-a-year analytics department of the NBA’s Philadelphia 76ers, which, among other things, helps the team determine the best players to match up against competitors from the opposing team. Fiddyment’s analyses are aided by data from an AI camera-tracking system called Second Spectrum, which tracks players by jersey numbers. In 2013, Second Spectrum installed its cameras in the rafters of every NBA arena.
“[We] use high-speed video to see where the players are standing on the court as the game happens,” says Fiddyment. “We get a breakdown of coordinates and detailed actions like shots, passes, rebounds, etc. To get the same data during practice, we partner with a company called Kinexon, which tracks the player position with wearable sensors and helps measure player load. This can help calibrate workouts for players as they gear up for the season or return from injury.”
Men’s hockey director of analytics Katie Yates (ENG’16) honed her analytical expertise at the College of Engineering, where she earned a master’s degree in mechanical engineering. Four years ago, when she was a general office assistant for the team, she persuaded then-coach David Quinn (CAS’89) that he needed to start exploiting the power of analytics. Yates writes the software that tracks gameplay, which helps coaches determine which plays and situations work and which don’t, and which players and combinations are driving those situations. Biometrics (the heart rate of every athlete is tracked during games and practices) are followed by Catapult, whose data is shared in real time with strength coach Kyle Czech.
“We look at individual player performance and we look at the team as a whole,” says Yates. “We also see what results we are getting when a particular player is on the ice and what happens when a particular player is teamed up with another player.”
Yates and Czech can literally see the biological stress of a game that is so intense that players normally skate in 45-second shifts. “They can go a little longer,” she says, “but if you’re out there for two minutes, you are in the weeds, and you are going to be scored on.”
The goal, she says, is to help the coach know the team as well as he can, and to be able to objectively assess strengths and weaknesses. “Everything is to some extent an educated guess,” she says. “We just want to be as educated as possible.”
Other BU teams have benefited from analytics support from graduate students in the University’s Master of Science in Statistical Practice (MSSP) program, within the Program in Statistics, which is overseen by program director Eric Kolaczyk, a College of Arts & Sciences professor of mathematics and statistics. For the past three years, Kolaczyk’s students have worked with women’s basketball, soccer, and rowing. For basketball, they built a web-based app that transformed simple box scores to a numerical and visual summary that would make most professional teams proud. For women’s rowing, they built a similar app that allows coaches to track athlete performance in a variety of conditioning tests throughout the off-season, then merged that data with information about sleep and resting heart rates.
“That allowed us to look at the rhythm of the academic year, to learn how various academic stresses affect athletic performance,” says Madeline Davis, director of women’s rowing. “The data was particularly helpful in evaluating training for athletes who had been ill or injured, figuring out how to most effectively build their training back up while keeping their heart rates in the appropriate training zone through cross training and the rowing motion.”

Sports analytics has come a long way since it helped the Oakland A’s win 20 straight games, and analysts of the market for sports analytics are predicting that it will grow 43 percent, to $4.5 billion, by 2024. Andy Andres, a College of General Studies senior lecturer in natural science and mathematics, who has taught courses in sabermetrics, has watched its focus evolve from player acquisition to optimizing gameplay to the science of biomechanics. Andres says machine learning is now modeling repetitive motions, like pitching, so that athletes can move more efficiently and avoid motions that are likely to lead to injury.
There is also an entirely different plane of data analytics, one where sports analytics is stood on its head, and analytics itself is the sport. That’s the foundation of fantasy sports teams, and it’s also the soul of the March Madness partnership of Google and the NCAA, for which the association shared 80 years’ worth of collegiate basketball statistics and Google shared the analytical power of Google Cloud. NCAA bracket makers, both official and fans, were invited to run queries on just about anything, such as which teams play better on the road, and how far from home the road has taken them. For many analytics fanatics, that’s the sports event of the year. For Google and the NCAA, it’s promotional win-win, by any analysis.

This Series
Also in
Big Data, Big Impact
-
March 7, 2019
Netflix, Spotify, and How Data Is Shaping the Arts
-
April 2, 2019
How Our Clicks Are Shaping Elections
-
July 16, 2019
What You Read and Watch Is Changing Media Forever


Comments & Discussion
Boston University moderates comments to facilitate an informed, substantive, civil conversation. Abusive, profane, self-promotional, misleading, incoherent or off-topic comments will be rejected. Moderators are staffed during regular business hours (EST) and can only accept comments written in English. Statistics or facts must include a citation or a link to the citation.