Netflix, Spotify, and How Data Is Shaping the Arts
Data analytics isn’t merely framing the art we see or listen to. It’s becoming the art
A generation ago, the internet changed everything. Today, data science is proving just as revolutionary. Fueled by the abundance of personal information on the internet—yours, ours, everyone’s—data science is making business smarter, healthcare more efficient, technology easier, and sports more fun to watch (and play). But it’s also made all of us more vulnerable. This article, part of a five-story series, comes as Boston University is investing aggressively in the world of big data and is poised to build a 17-story Data Sciences Center on Commonwealth Avenue that will house its mathematics and statistics and computer science departments. As BU President Robert A. Brown said: “This is the science that’s going to change the way we behave, driving our behavior for the next 50 or 100 years.”
Like most stories about data science, this one begins with a very big number: 150 million. That’s roughly how many people, worldwide, subscribe to Netflix. And because Netflix knows what all of those people watch, when they watch, and on what sort of device they watch, that number provides Netflix with the data it needs to determine the narratives, characters, and lengths of the programming to invest in. So when you binge on a season of Stranger Things over a school vacation week, then enjoy a weeknight with the comedy special of Ellen DeGeneres, and finally settle in on a chilly Saturday night to watch the recent Best Foreign Language Film Academy Award winner Roma, you aren’t just consuming art. You’re shaping it.
Netflix programming is refined with algorithms designed to produce popular shows, and then aimed at people whose personal viewing habits suggest that they might like them—two reasons that Netflix original shows are deemed successful 80 percent of the time. That number indicates that the algorithms are working: traditional TV shows have a success rate of about 40 percent. Netflix gets so granular with its data mining that it even tests different thumbnail images on viewers around the world, then presents those viewers with pictures that the data indicates will appeal to their particular demographic.
How do you take something that you see in nature, like weather, and create it with code? It’s fascinating how an algorithm can create beautiful patterns like birds flocking in the sky.
Similar forces are at work at Spotify, where the musical choices of more than 100 million users point the way to popular success. Spotify’s data allow the online distributor of music to compile a Discover Weekly feature that sends individual users a weekly playlist designed to suit their specific tastes. Like Netflix, Spotify knows what you want, and gives it to you straight. It’s a strategy that doesn’t just please users, it saves the distributors lots of money that once would have been spent on marketing. And just as Netflix produces original video series and movies, Spotify last year started signing licensing deals with independent artists, evolving from being merely a content distributor to a content creator. The only reason that’s possible is because Spotify now knows what to create—thanks to data.
Data analytics, or the science of learning from raw sets of information, isn’t just framing the works of art that we see or listen to. Very often, it becomes the art—incorporated in works of visual art, music, and other mediums. James Grady, a College of Fine Arts assistant professor of art and graphic design, says visual artists tend to use data in one of two ways: in elegant presentations of meaningful information, and to add an element of “aesthetic complexity” to their work. The challenge, he says, is this: “How do you take something that you see in nature, like weather, and create it with code? It’s fascinating how an algorithm can create beautiful patterns like birds flocking in the sky.”
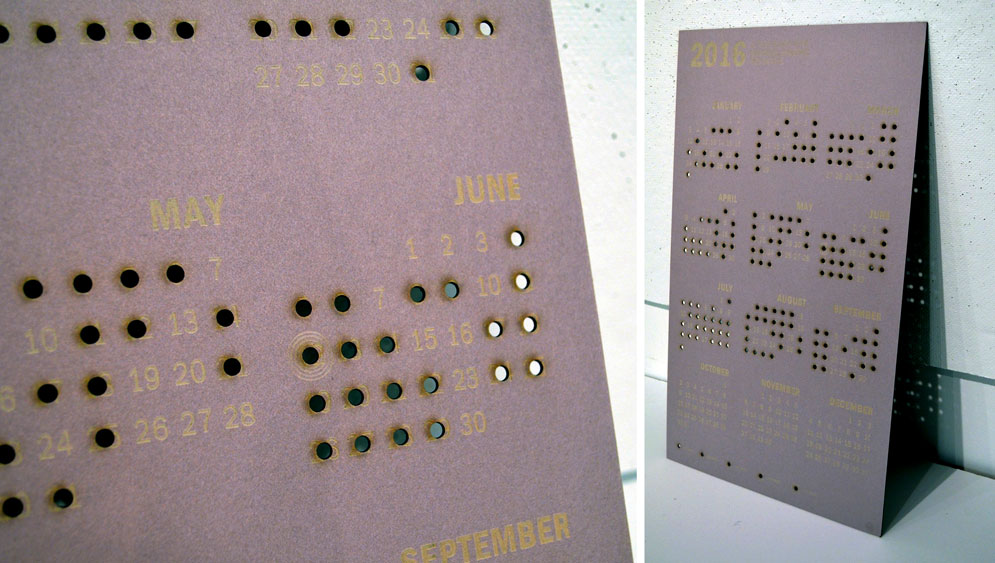
Grady says the past 10 years have seen more visual artists, including some at CFA, working data into their art in creative, and moving, ways. His former student Ivanna Lin (CFA’18) used a database of mass shootings in 2016 to create a calendar with bullet-size holes piercing dates that a shooting occurred.

Visual artist Ivanna Lin (CFA’18) worked with a database of mass shootings in 2016. She made a calendar with bullet-size holes piercing dates of shootings. Photos by Ivanna Lin/IvannaLin.com
“Data is extremely powerful,” says Lin, now a designer on the creative team at Education First, an international education company that specializes in educational travel. “I could have simply taken the numbers and displayed them in a traditional format, but I wanted to create an impactful experience instead. I wanted people to walk away feeling something.”
Boston artist Nathalie Miebach incorporates data into more than one media. Miebach takes weather data, for example, and translates it first into musical scores, which are later translated into works of sculpture. Her goal, she says, is to give audiences a greater awareness of the world around them. And New York data artist Laurie Frick, who worked for technology companies for 20 years, uses data from the steps on her Fitbit and her iPhone’s GPS to construct large-scale installations. Musicians have also welcomed data to their world. Composer Richard Cornell, a CFA professor of music, composition, and music theory, points out that their embrace of computing power is not new: it started back in the 1970s, when tools for the resynthesis of sound became available.
The line between what is real and artificial is now more of a continuous gray area. So you have this kind of fantastical thing that feels real, but can’t be real. It’s a new domain that is not electronic and not acoustic, but somewhere in between.
“Digital signal processing allowed composers to manipulate sounds,” says Cornell, and that created a rich environment for the way sounds change, or can be changed.
That exploration has evolved, Cornell says, with the exponential increase in speed and efficiency of the processing power. In recent years, it has inspired works like Joshua Fineberg’s La Quintina, which uses algorithms to mimic four-part harmonies sung by people in a small village in Sardinia. Fineberg, a CFA professor of music, composition, and music theory, says the four musical parts work together to produce a phantom fifth voice, which Sardinian singers associate with the Virgin Mary. Much of Fineberg’s work uses algorithms to separate musical sounds into what he calls their source and their filter, and to recombine those elements in new and interesting ways.

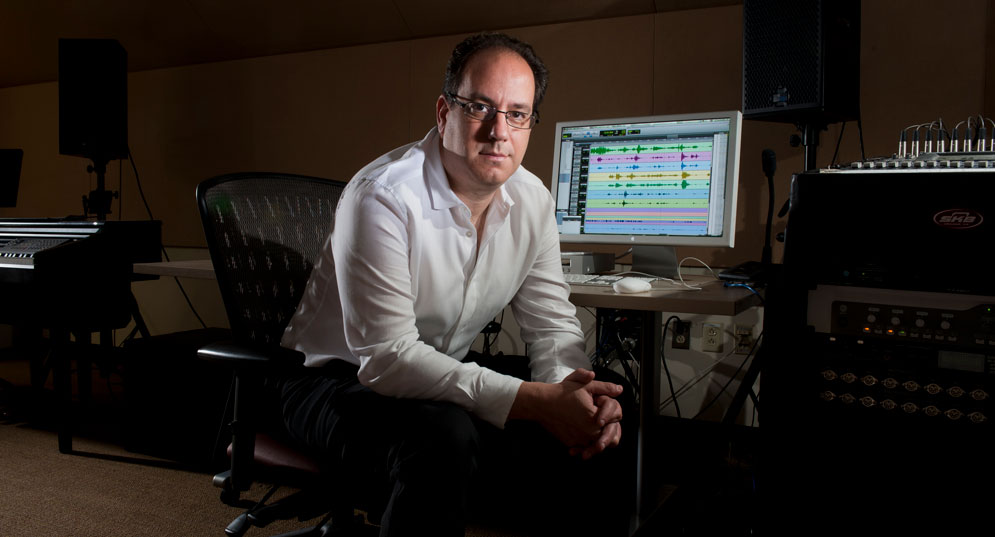
Joshua Fineberg, a CFA professor of music, composition, and music theory, says data has influenced music the same way it has influenced films, blurring the lines between what is real and what is artificial. Photo by Frank Curran
“We can now process large amounts of data and do a detailed analysis that keeps all the richness and the messiness of real sounds,” says Fineberg. “Those lines have become blurry in a good way.”
He compares the influence of data on music to its influence on film. “The line between what is real and artificial is now more of a continuous gray area,” he says. “So you have this kind of fantastical thing that feels real, but can’t be real. It’s a new domain that is not electronic and not acoustic, but somewhere in between.”
Fineberg, who is a former Massachusetts Cultural Council Artist Fellow, considers the algorithmic leap forward to be a natural evolution of musical composition. The classically trained musician says that from his perspective, classical composers have always worked with what are essentially large data sets, with each composer making relatively small tweaks to the data.
Ketty Nez, a CFA assistant professor of music, composition, and music theory, also composes with algorithms. But rather than build algorithms to convert data from natural events, her algorithms build on the music, layering in harmonic fifths and sevenths and thirteenths as in her piece Four Scenes for Juliet.
“You can use algorithms for layering, and you can get some unpredictable results,” says Nez, who trained as a classical pianist and spent years playing what she calls 19th-century warhorses. “I can create scores from sequences or chords. I don’t hear the chords. I hear the results of what my algorithms create. It allows me to hear things that I would never come up with on my own. And of course, very often they don’t work.”
As Nez has learned, data, for all of its pluses, doesn’t always have the right answers.
Even Netflix might admit to that. How else to explain one of its most critically panned original series, Sick Note, about a character who fakes having cancer to win sympathy?
Artist Nathalie Miebach is speaking at School of Visual Arts, at CFA on March 26 at 3:30 pm in Room 500, 855 Commonwealth Ave.

This Series
Also in
Big Data, Big Impact
-
May 1, 2019
Sports Is Now Science. How Did That Happen?
-
May 29, 2019
Know What’s Good for Your Health? Artificial Intelligence
-
July 16, 2019
What You Read and Watch Is Changing Media Forever


Comments & Discussion
Boston University moderates comments to facilitate an informed, substantive, civil conversation. Abusive, profane, self-promotional, misleading, incoherent or off-topic comments will be rejected. Moderators are staffed during regular business hours (EST) and can only accept comments written in English. Statistics or facts must include a citation or a link to the citation.