Data Storytelling Is for Everyone
COM workshops teach finding, mining, and presenting digital information
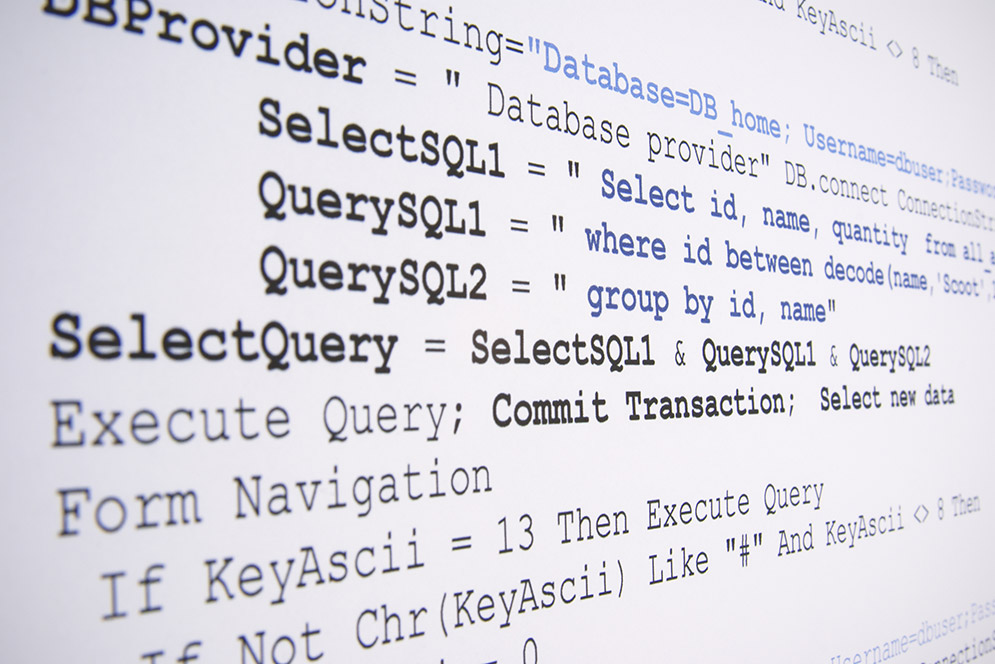
Participants in the Storytelling with Data Workshops will learn methods for scraping from a website and new data visualization techniques. Photo by ermingut/iStock
Data points are everywhere. Swipe a credit card, buy something online, or upload a pet video to Facebook, you leave a data point. Just about everything that a corporation or government does leaves a digital footprint as well. These days, a lot of people want to use that data to find an answer or make a point, but it’s not always easy.
“An incomprehensible amount of digitized data has been collected and stored globally,” says Maggie Mulvihill, a College of Communication associate professor of the practice in computational journalism. “Everybody is trying to harness the meaning of that data and grappling with how to present it effectively.”
That’s the focus of COM’s fourth annual Storytelling with Data Workshops, being held June 5 to 9 and 12 to 16. Registration is open now, offering student, nonprofit, and professional rates. (Keep up on Twitter @BUStorywithData.)
“It’s a very intensive training in skill sets really needed by every occupation,” says workshop founder and executive director Mulvihill, who is also a Rafik B. Hariri Institute for Computing and Computational Science & Engineering faculty fellow and cofounder of the New England Center for Investigative Reporting.
The workshops include lessons in data collection—how to scrape data from a website or extract it from social media, how to clean “dirty” data of errors and formatting problems, and how to find high-quality data in places you might not think to look. “You don’t have to be a coder,” Mulvihill says. “There are so many tools that journalists use that are point-and-click open-source tools. You can scrape a website in a couple of clicks, for free.”
The workshops also focus on how to tell the stories the data present, whether you’re trying to steer a boss to the correct budget decision or extoll your nonprofit’s effectiveness in helping its clients.
“How do you write a powerful story when you have so much numerical data?” Mulvihill asks. “The fewer numbers the better. People don’t want to read an array of statistics—they want narrative. That’s one of the biggest learning arcs for people. They come with Power Point decks, slide after slide junked up with numbers and statistics. But people care about people.
Journalists have been leaders in mining available data to find the stories within—matching, say, a criminal records database to the list of school bus drivers in a state—but it’s hardly their exclusive province anymore. The BU workshop doesn’t market itself to journalists, who are already served by well-known digital reporting events.
“We’ve learned that content creators in many fields are interested in learning how they can extract information from big data sets and use it to craft stories,” says Thomas Fiedler (COM’71), dean of COM. “It’s irrelevant whether the stories are to be used for journalism, to pitch a prospective client, or to craft a message to impact a specific audience.”
The first three years of workshops have attracted librarians, engineers, a social worker, financial analysts, political consultants, and grant writers for nonprofits, as well as grad students who wanted to sharpen their skills for working on a dissertation or thesis.
In addition to Mulvihill and Brooke Williams, a COM assistant professor of journalism and associate director of the data storytelling workshops, the faculty are Margot Williams, Intercept research editor for investigations, Aaron Kessler, senior producer for data/investigations at CNN, and Sona Patel, New York Times senior social strategy editor.
“Teaching storytelling is COM’s core mission,” says Fiedler. “Obviously, students in computer science know how to use big data sets for information. But what they typically can’t do is convert that information into an impactful story.”
At the end of the workshop, participants will have earned digital badges for posting to an online résumé or a LinkedIn page, certifying that they’ve completed one of three tracks: basic Data Storytelling; Advanced Data Storytelling, which includes techniques such as SQL (structured query language); and Storytelling with R, for hardcore users who are mastering that open-source statistical program.
Comments & Discussion
Boston University moderates comments to facilitate an informed, substantive, civil conversation. Abusive, profane, self-promotional, misleading, incoherent or off-topic comments will be rejected. Moderators are staffed during regular business hours (EST) and can only accept comments written in English. Statistics or facts must include a citation or a link to the citation.