Mapmaker/Matchmaker
Suchi Gopal and the power of maps
Mapmaker / Matchmaker
Suchi Gopal and the power of maps
By Barbara Moran

Suchi Gopal bursts into her classroom, buzzing with energy. The 11 graduate students parked behind glowing computer monitors rouse themselves from reverie. It’s late in the semester and they are preoccupied with their final projects. But Gopal has more to teach. “Aha!” she claps with delight. “Today we will do some math!”
“I want to solve real-world problems. I don’t want to write something that’s buried in a journal. I want to work with actual people to make a difference,” says Gopal. “All this data is only good if it addresses a societal problem.”Over the past two decades, as computing power has increased, GIS has risen from an obscure tool for measuring Canadian farms to a powerful technique that maps everything from the eating patterns of orangutans to health care access in Zambia. And Gopal, with her expertise in statistics and geography, as well as her wide-ranging scientific interests, rides the tip of this trend. Her students in Introduction to GIS come from public health, social work, geography, neuroscience, anthropology, and myriad other fields to learn how to turn their dry data into spectacular maps. Today, Gopal is teaching them the power of computing by snatching it away. “Who wants to go to the board and work out the math? C’mon, I’ll help you!” Smiling, cajoling, Gopal encourages two students to the board, where they begin to solve a series of tedious equations, usually crunched by computer. Finally, the students find an answer: 29.374. Gopal circles it in blue chalk. “This is the temperature of just one unknown location,” she says. “You see how much work that was? On the computer, everything is so sweet and quick.” The exercise is Gopal’s work in a nutshell: years of research, thousands of data points, millions of calculations, all painstakingly collected, entered, checked, and finally hidden behind a beautiful, brightly colored map that anyone can understand intuitively. But Gopal’s talent goes far beyond the science of data crunching. She is gifted in the unteachable art of weaving: bringing together seemingly unrelated ideas and people to attack thorny problems. Her colleagues describe her as equal parts mapmaker and matchmaker.
Maps Can Lie

Smarter Satellites
After finishing her PhD, Gopal joined BU’s geography department in 1989 and soon embarked on an unusual collaboration with neural modeler Gail Carpenter, who was studying pattern recognition. Gopal had done related work at UCSB, building an artificial intelligence model to study how people use patterns and landmarks to navigate through space. The geographer and the neuroscientist thought their combined understanding of brains and mapping might help solve a growing problem: data overload. “Back then, everyone was already saying that they were overwhelmed by data,” says Carpenter, a CAS professor of cognitive and neural systems and of mathematics. “It’s nothing like it is today, but even then people were already overwhelmed.” Gopal and Carpenter were looking at a particular set of data: thousands upon thousands of ground images from Landsat satellites. It was a classic case of Too Much Information: the photos were great, but it took humans months—if not years—to analyze them. The scientists wanted to make the satellites more like people: choosier about the data they collect. “One of the things that makes us different from satellites is how we pay attention,” says Carpenter. “We know what to ignore.” Take driving, for instance. “You don’t notice every single tree, but you notice the fire truck coming; We filter out the unimportant stuff. That’s how we handle lots of data with a pretty narrow bandwidth.” Could satellites be taught to do the same? Carpenter and Gopal developed a computer learning system—a series of algorithms that would allow a computer to look at Landsat images and discern mixtures of land cover, finding percentages of, say, wetland, conifer forest, and grass. Their system took minutes to churn through a photo that humans needed six months to analyze, with results of the same accuracy. “We developed methods that Suchi and her students still use all the time,” says Carpenter. Gopal and Carpenter have remained friends and colleagues over the intervening decades, collaborating on research and lecturing in each other’s classes. “It takes a long time to establish interdisciplinary research, and she’s great at that,” says Carpenter. “But her best quality is generosity. Some people never learn the importance of being generous, but she just shines there.” This generosity has given Gopal a web of connections stretching from her childhood pen pal in California (who she still keeps on speed dial) to scientists across disciplines and around the world. The range of her research is astonishing, and now it often loops back to the questions of health that originally drew her to geography. She helped Susan Proctor of the US Army Research Institute of Environmental Medicine on a School of Public Health study mapping the incidence of Gulf War Veterans’ Illnesses in soldiers. She helped James McCann, a professor of history at BU’s African Studies Center, find hot spots of malaria in Ethiopia. And she’s working with Davidson Hamer, a professor of global health and medicine at SPH, to understand how pregnant women access health care in Zambia. Gopal is also the principal investigator on a five-year, $2.9 million National Science Foundation grant that integrates STEM research into the science curricula of local schools, by pairing BU graduate students with teachers. The grant has impacted over 2,000 middle school students so far. “I want to solve real-world problems. I don’t want to write something that’s buried in a journal. I want to work with actual people to make a difference,” says Gopal. “All this data is only good if it addresses a societal problem.”The Movie of What Happened
The power of Gopal’s research is evident in an interactive map called MIDAS, developed with Les Kaufman for an ambitious project in Belize. In 2005, Kaufman, a CAS professor of biology with Boston University’s Marine Program, received an $12.5 million grant from Conservation International to examine ocean zoning projects. Belize had “protected” certain ocean and coastal areas from fishing, but were the protections actually working? What could the country do better? Where should they spend their money? To answer these questions, Kaufman needed data. And maps. And people. He needed Suchi Gopal. “She has an excellent formal background in spatial mathematics and map theory, and she’s, of course, very skilled at GIS,” says Kaufman. “But she also understands people. Because Suchi is empathic, she can relate to people better than most geeks. And that was one of the biggest missing elements of the team I was trying to build.” Kaufman approached Gopal and asked her to build a map. Not just any map, but something new: an interactive tool that could help people make decisions, sort of like SimCity for the coast of Belize, but with real data. “People in Belize had no access to complete and accurate maps of their natural resources and marine habitats,” says Gopal. “How do you give them the best science that we know? And how do you help them make a decision? So that was the tool that Les asked me to make. And we needed people to use it. Otherwise, it’s worthless.”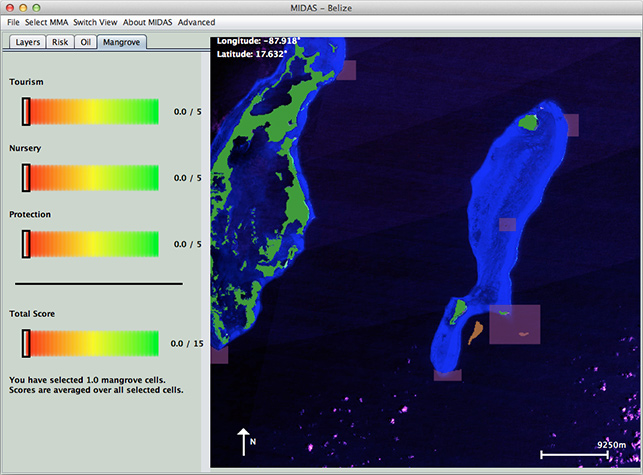
Comments & Discussion
Boston University moderates comments to facilitate an informed, substantive, civil conversation. Abusive, profane, self-promotional, misleading, incoherent or off-topic comments will be rejected. Moderators are staffed during regular business hours (EST) and can only accept comments written in English. Statistics or facts must include a citation or a link to the citation.