A New Map for Greenhouse Gas
Novel tool can help cities meet climate change goals
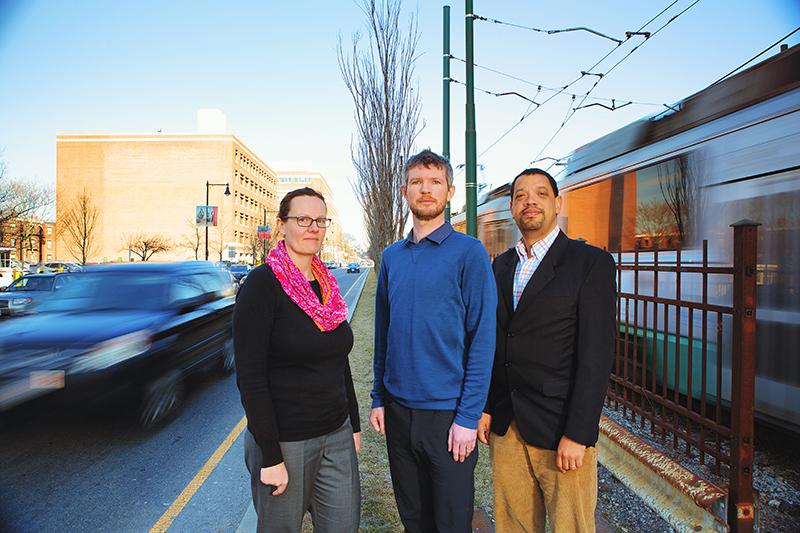
Lucy Hutyra, Conor Gately, and Ian Sue Wing, from the GRS department of earth and environment, developed a new way to measure CO2 emissions from cars. The new system, called DARTE, could help cities combat climate change. Photo by Michael D. Spencer
The Kyoto Protocol, an international treaty to reduce greenhouse gas emissions, went into effect in 2005, without the United States on board. This wasn’t a big surprise: in a 2001 letter to Congress, President George W. Bush had called it “an unfair and ineffective means of addressing global climate change concerns.”
But where the federal government left a gap, cities stepped in. In 2005, Greg Nickels, then mayor of Seattle, called on other United States mayors to sign the US Conference of Mayors Climate Protection Agreement, pledging to lower emissions of carbon dioxide (CO2) and other greenhouse gases. Cities are responsible for about 70 percent of CO2 emissions worldwide, and to date, 1060 mayors from Jacksonville to Juneau have signed the agreement.
But there’s a problem. For cities to cut down CO2, they need to know how much they are producing and reducing. Most cities get rough estimates with “carbon calculators” that account for the size and population of a city, electricity used, and an estimate of how many cars zip (or crawl) through the city streets. The calculation would be fine except for all those cars, says Conor Gately (GRS’15), a PhD candidate in College of Arts & Sciences earth and environment department, who is lead author on a study examining cities, traffic, and CO2, published in the Proceedings of the National Academy of Sciences (PNAS) in April 2015. “Cars are the hardest part of the emissions equation to quantify,” says Gately. “They are moving all the time at different speeds, and there are different cars on the road at different times of day.” There are other factors to consider. There’s the make of the car, of course: a Toyota Prius gives off less CO2 than a Chevy Silverado. There’s also the speed; most cars give off the least CO2 when cruising in a “sweet spot” between 40 and 60 miles per hour.
It’s enough to make anyone despair of ever getting an accurate CO2 count, but ignoring cars is not an option. Why? Because vehicles are a critical part of the carbon equation, according to Gately, producing 28 percent of fossil fuel CO2 emissions in 2012, responsible for almost half the growth in total US emissions since 1990. President Obama recognized this when he pledged to lower US CO2 emissions by pushing hard on two sectors in particular, power plants and cars. But compared to measuring emissions from cars, power plants are a piece of cake, says Gately. “Power plants stay still, and you can just gather all the information you need from them,” he says. “You can’t ask everyone in a city like Boston exactly how and where they drive every day.”
It’s a problem that Carl Spector, director of Boston’s climate and environmental planning department, knows all too well. Spector oversees the city’s annual greenhouse gas inventory and says that car emissions are a tough nut to crack. In the past, Boston has tackled the car conundrum by using an elaborate model, developed by the Central Transportation Planning Staff, that calculates the miles traveled per car, and includes census data, locations of jobs and schools, commuting patterns, availability of public transportation, and other factors. “It’s a huge process,” says Spector. So huge, he notes, that the city has been relying on miles-traveled calculations for 2010, and projections for 2020, with no details for the years in between. “Because we were keenly aware of the limitations,” says Spector, “we’ve been trying to find a way to show how driving behavior and traffic patterns change from year to year.”
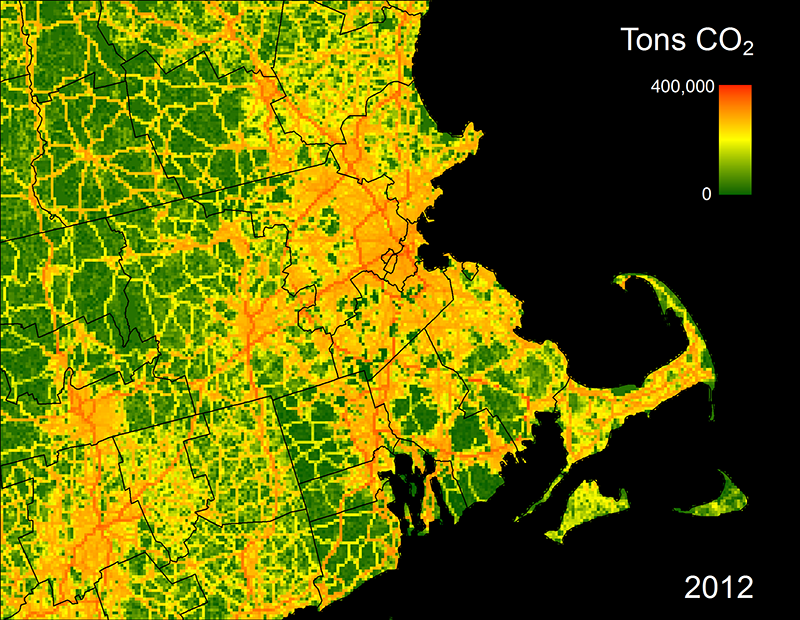
Gately’s work aims to do just that. Funded by grants from the National Aeronautics and Space Administration (NASA), the National Science Foundation (NSF), and the Department of Energy (DOE), Gately has developed a more precise way to tally CO2 emissions from vehicles. He used 33 years of traffic data to build the Database of Road Transportation Emissions (DARTE), which displays CO2 data for the contiguous US on a finer scale than ever before—a one-kilometer grid. (He hopes to add Alaska and Hawaii later.) Available for free download, DARTE could change the way cities and states measure greenhouse gas emissions.
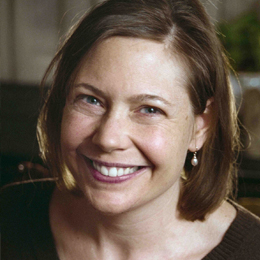
“The science is coming together to bring us very fine measurements in a way never possible before,” says Lucy Hutyra, an assistant professor of earth and environment and a coauthor on the PNAS study. Hutyra says that DARTE complements NASA’s Orbiting Carbon Observatory 2, which is collecting global data on atmospheric carbon dioxide. “We need good bottom-up data to match what we’re measuring looking down from space. That’s what we need to really advance greenhouse gas policies.”
To build DARTE, Gately needed a source of traffic data, and he found one in the Highway Performance Monitoring System, developed by the US Federal Highway Administration (FHWA). The database contains traffic counts on over 85 percent of the public roads in the United States. All 50 states submit data to the federal government each year, and officials at the FHWA were happy to share it with Gately. He then faced the unenviable task—“pure grunt work,” he calls it—of assimilating 33 years of traffic data, of varying scale and quality, from the states. This helped him discern traffic patterns overall. But to determine CO2 emissions, he had to take it a step further, matching that data against estimates of the types of vehicles on the road during those years, correcting for changing fuel economy, and then validating the calculated tailpipe emissions with gasoline and diesel fuel sales for every state.
The work took three years and “a combination of ambition, grit, and technical expertise,” says Ian Sue Wing, an associate professor of earth and environment and a coauthor on the study. “I was like one-man Big Data,” laughs Gately. “I had to get down into the muck to make it user-friendly.”
Gately hopes that DARTE’s precision and ease of use will help cities locate CO2 “hotspots,” like certain roads or intersections, and target those hotspots through new policies, like altering traffic patterns, designing new streets, or targeting mass transit expansions.
“We want to know how we’re doing and get some sense of where we need to make bigger efforts,” says Spector, who says he has already used preliminary data from DARTE to adjust their model’s traffic predictions.
“Cities can use this analysis, coupled to a baseline measurement, and can see if they’ve made progress, if their policies have been effective,” adds Sue Wing. “Until now, we didn’t have the data to see if efforts were paying off on the scales at which decisions were being made.”
Gately plans to expand DARTE by including emissions data for other pollutants, like carbon monoxide and sulfur dioxide. Even if the federal government eventually implements national targets for all greenhouse gases and air pollutants, DARTE will still be useful, says Gately. “Even national targets won’t get implemented through a one-size-fits-all policy. They will have to be tailored for states and cities,” he says, “and we believe DARTE will be a very useful tool for doing just that.”
Comments & Discussion
Boston University moderates comments to facilitate an informed, substantive, civil conversation. Abusive, profane, self-promotional, misleading, incoherent or off-topic comments will be rejected. Moderators are staffed during regular business hours (EST) and can only accept comments written in English. Statistics or facts must include a citation or a link to the citation.