The role of left hemisphere and right hemisphere in language recovery in patients with aphasia

In another study (Sims, in press), we analyzed the relationships between semantic processing behavioral data, lesion size and location, and functional percent signal change from functional magnetic resonance imaging (fMRI) data. This study included 14 persons with aphasia in the chronic stage of recovery (six or more months post stroke) and eight healthy controls who performed semantic processing tasks of determining whether a written semantic feature matched a picture or whether two written words were related or not. Using region of interest (ROI) analysis, we found that percent signal change in left inferior frontal gyrus pars opercularis and pars triangularis, despite significant damage, were the only regions to correlate with behavioral accuracy. Additionally, the more the damage to LIFG, LMTG and AG/SMG, the higher the percent signal change in bilateral superior frontal gyrus, middle frontal gyrus, and anterior cingulate, suggesting that these regions appear to serve as an assistive network in the case of damage to traditional language regions. Relative to controls who showed mainly positive correlations in activation between and within LH and RH ROIs, patients showed positive and negative correlations. Specifically, the right inferior frontal gyrus pars orbitalis is presumed to serve a monitoring function. These results reinforce the importance of the left hemisphere in language processing in aphasia, and provide a framework for the relative importance of left and right language regions in the brain.
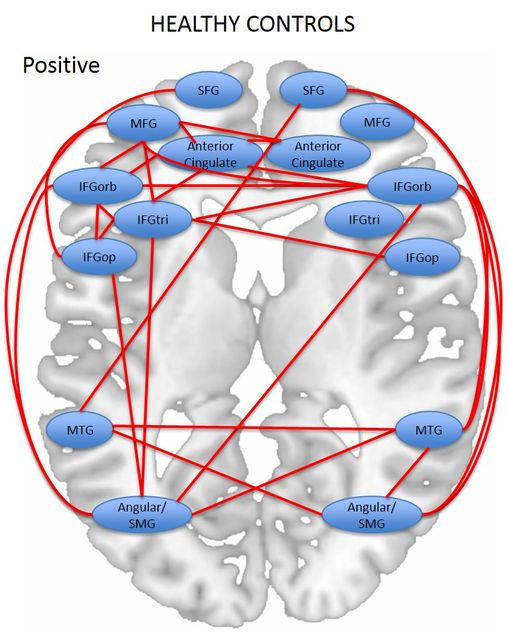
- Signal correlations across regions. This diagram summarizes signal-to-signal correlations across regions, for normal controls. Note labels for positive versus negative correlations.
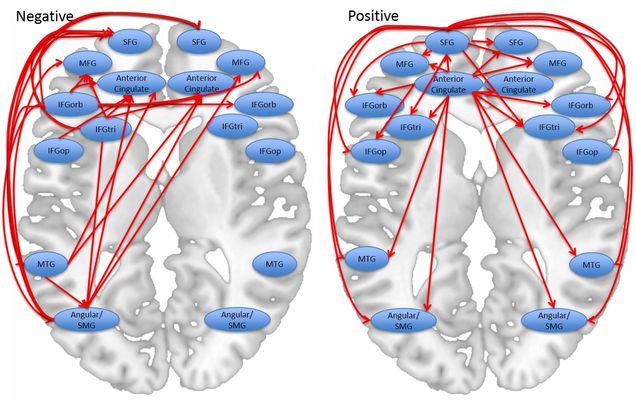
- Correlations between spared tissue and signal change. This diagram summarizes the spared to signal correlations for PWA. The region that an arrow originates from is the percent spared tissue region; the region that the arrow terminates at is the region showing signal change. Note label for positive versus negative correlations.