I. Female Representation among Tenured and Tenure-track
Faculty: 1997 and 2007-2011
Fig. 1-A Numbers of Females and Percentage Female of Total
Tenured Faculty, 1997 and 2007-2011Fig. 1-B Numbers of Females and Percentage Female of Total
Tenure-track (non tenured) Faculty, 1997 and 2007-2011
Fig. 1-C Numbers and Percentages of Tenured and Tenure-track
Faculty by College, Rank, and Gender, 2007-2011
Fig. 1-D Changes in Percentage Female Representation by Rank,
2006-07 to 2010-11Fig. 1-E Tenured and Tenure-Track Faculty: Changes in Numbers of
Males and Females, by Rank, between 2006-07 and 2010-11
Overview
There was an overall increase in female representation in the 4-year period from AY 2006-07 to AY 2010-11. In the CAS Natural Sciences and Engineering, this was quite substantial but pretty much limited to Assistant Professors; the representation of females among Associate and Full Professors did not change significantly.
Tenure-track (non tenured) faculty (TTK)The percentage female of the TTK (tenure-track, non tenured) faculty went, in the Natural Sciences, from 18% to 33%, and, in Engineering, from 19% to 24%.
Tenured and tenure-track faculty, combined (TEN/TTK)Although the final numbers include two Professors who moved out of CAS (one male into SAR, one female into ENG), the percentage female of the tenured and tenure-track faculty combined changed as follows:
- CAS Natural Sciences: 12.8% in 2006-07 15.7% in 2010-11
- CAS as a whole: 25.0% in 2006-07 28.1% in 2010-11
- College of Engineering: 11.4% in 2006-07 13.5% in 2010-11
- Sargent College: 56.5% in 2006-07 66.7% in 2010-11
This reflects a net increase in the number of female TEN/TTK (tenured and tenure-track) faculty members of 7 in the Natural Sciences, 2 in Engineering (without the transfer, that would have been 8 and 1, respectively), and 3 in Sargent over the 4-year period from 2006-07 to 2010-11.
Full professorsThe increases in female representation among Assistant Professors during the period from 2006-07 to 2010-11 were not matched by increases at the senior level. The change in the number of female Full Professors in CAS Natural Sciences and ENG can be attributed to the transfer of a single female Full Professor; otherwise the numbers of Full Professors in both colleges has remained constant, although there have been changes within specific departments.
Tenured facultyWithout counting the one transfer, the number of tenured female faculty members has declined (by 1) in CAS Natural Sciences, but increased (by 2) in ENG (2 female Associate Professors received tenure without promotion) and (by 1) in SAR.
As of 2010-11, 1 of the 9 CAS Natural Sciences departments had no tenured females (Earth Sciences), and 3 of the 9 departments (including that one plus Computer Science and Astronomy), as well as 2 of the 3 departments in ENG (Electrical and Computer Engineering and Mechanical Engineering), had no tenured female Full Professors.
Fig. 1-A Numbers of Females and Percentage Female of Total Tenured Faculty,
1997 and 2007-2011

Fig. 1-B Numbers of Females and Percentage Female of Total Tenure-track
(non tenured)
Faculty, 1997 and 2007-2011

Fig. 1-C Numbers and Percentages of Tenured and Tenure-track Faculty
by College, Rank, and Gender, 2007-2011
CAS
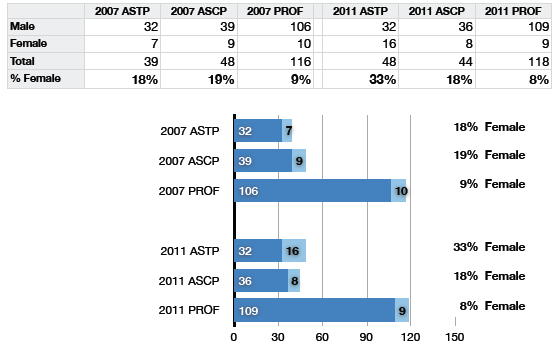
ENG
SAR


Fig. 1-D Changes in Percentage Female Representation by Rank,
2006-07 to 2010-11

Fig. 1-E Tenured and Tenure-Track Faculty: Changes in Numbers of
Males and Females, by Rank, between 2006-07 and 2010-11


Return to the main page for this Web report on the Status of Women in the Natural Sciences and Engineering at Boston University, Summer 2012 or jump to section:
<1> Female Representation among Tenured and Tenure-track Faculty: 1997 and 2007-2011
<2> Female Representation by Tenure Status
<3> Hiring Patterns
<4> Attrition
<5> Success in Tenure and Promotion
<6> Time at Rank
<7> Salaries
<8> Leadership Positions, 2010-11
<Conclusions>

