First- and second-order Motion Perception in Gabor Micropattern Stimuli: Psychophysics and Computational Modelling
Colin C. Clifford, Joshua N. Freedman, Lucia M. Vaina
INTRODUCTION
Braddick [4] proposed that two processes, which he termed short- and long-range, underlie motion perception in humans. The short-range process was presumed to be mediated by simple motion selective filters with limited spatiotemporal support, while the long-range process was thought to operate by matching features over greater distances and longer time intervals. The use of the short-range / long-range distinction has been criticised on the grounds that the dichotomy might lie in the different types of stimuli that have been used to study motion perception rather than in distinct processing mechanisms [7,6]. Cavanagh and Mather [7] argued for an alternative classification which rests on the distinction between first- and second-order [8]. First-order motion is defined by spatiotemporal changes in luminance, second-order motion by stimulus attributes such as contrast, flicker and spatial frequency. However, much of the evidence supporting the existence of separate first- and second-order motion channels also involves a dichotomy in stimulus type, this time between stimuli in which motion is defined by changes in luminance and those in which motion is perceived in the absence of luminance cues.
To demonstrate that the first-order / second-order dichotomy genuinely reflects the operation of distinct processing mechanisms, Boulton and Baker [2,3] devised a stimulus containing both first- and second-order information. Their stimulus consists of an array of Gabor micropatterns which are displaced between frames in a two-frame sequence, generating a percept of apparent motion. Boulton and Baker found that, for a dense stimulus array, direction judgements appear to be governed by first-order information, and for a sparse array by second-order. They also found that direction of motion can be reliably discriminated over only short ranges in the dense stimulus, but over much longer ranges in the sparse.
It has subsequently been proposed by Lu and Sperling [13] that there are in fact three motion systems in human vision: a first-order system that uses a motion energy computation to extract motion from luminance modulations; a second-order system computing motion energy from texture and contrast modulations; and a third-order feature-tracking system. Lu and Sperling state that the nature of the motion computation in their third-order channel is as yet undetermined, but that motion energy analysis is a plausible candidate. We question the need to posit the existence of a dedicated second-order motion channel, in which motion extraction is preceded by texture grabbing, in addition to a feature tracking channel sensitive to motion defined by texture and contrast. As observed by Taub et al [16], many of the attributes which distinguish Lu and Sperling’s second-order system from their third-order system are actually common to their first- and second-order systems. Rather than there being two short-range channels, extracting motion with and without a preceding full-wave rectification, Taub et al propose that there is a single short-range channel preceded by a more subtle non-linearity.
We extend Boulton and Baker’s study [3] to investigate the effects of using stimuli whose motion is defined by purely first-order or purely second-order information. Here, the first-order stimulus consists of luminance-defined Gaussian micropatterns rather than Gabor micropatterns. In the second-order stimulus, only the Gaussian contrast envelopes of the Gabor micropatterns are displaced, while their luminance-defined sinusoidal carriers remain static. We put forward a computational model which predicts psychophysical direction judgements. The model is a variant of those proposed by Chubb and Sperling [9] and Wilson et al [18], consisting of two distinct channels. Motion in both channels is extracted by a motion energy computation [1]. The filtering in the short-range “first-order” channel is linear up to the point of motion energy computation, so it is able to extract first-order motion but is blind to second-order. In the long-range “second-order” channel the stimulus is pre-processed by a low-pass texture grabber [10,17], rendering it sensitive to first- and second-order motion. The activities of the two channels are compared to establish which governs direction judgements for a given stimulus. In the rest of the paper we will use the terms first- and second-order channels in this way, referring to: a linear channel, operating at fine scales and sensitive only to first-order motion; a channel computing coarse scale motion energy subsequent to the action of a texture grabber. It should be noted that the second-order channel thus defined is different from the second-order sytem of Lu and Sperling [13] in that it analyses motion at a coarser scale than the first-order channel.
PSYCHOPHYSICS
Methods
The following methods were adapted from Boulton and Baker [3]. The stimuli were generated on a Macintosh Centris 650 computer and presented on a Platinum Two Page Display SuperMac monitor which had a refresh rate of 75 Hz. A lookup table derived from photometer measurements was used to compensate for the nonlinear voltage-luminance characteristic. The stimulus raster size was 880×680 pixels (29.0×22.4cm), with 80 pixels subtending 1 degree of visual angle at the viewing distance of 150cm. The Macglib software package (Micro M-L, inc.) was used for developing the stimulus.
The stimulus used in Conditions 1 and 3 was an array of Gabor micropatterns, each formed by the multiplication of a sinusoidal carrier and a two-dimensional Gaussian window:
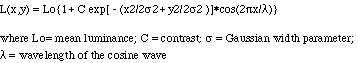
The Gabor functions used had a mean luminance of 9.2 Cd/m2, a contrast of 0.20, a Gaussian width parameter of 0.33 degrees, and a wavelength of 0.44 degrees. These stimuli were presented in six rows, three above and three below a central fixation point. The individual micropatterns were positioned on a notional grid and jittered horizontally and vertically to prevent periodicity and clustering effects. The dense stimulus was made up of 11 micropatterns per row, giving a mean centre-to-centre spacing of 2.25![]() between micropatterns. The sparse stimulus contained 6 micropatterns per row at a spacing of 4.5
between micropatterns. The sparse stimulus contained 6 micropatterns per row at a spacing of 4.5![]() . For Condition 2, the stimulus was an array of Gaussian micropatterns:
. For Condition 2, the stimulus was an array of Gaussian micropatterns:
![]()
with parameters as for the Gabor micropatterns described above.
Each frame of the two-frame apparent motion stimulus was presented for 187 msec (14 screen refreshes) with an onset asynchrony of 187 msec (i.e., no interframe interval). Between stimuli the mean luminance of Lo was maintained. Subjects viewed the stimulus from a distance of 150 cm, and were required to report the direction of apparent motion in a two alternative forced-choice procedure. In Conditions 1 and 2, the second frame of the stimulus was simply a displaced version of the first, with wraparound at the screen edges. In Condition 3, the second frame of the stimulus was drawn such that the envelope of each Gabor micropattern had been displaced but its carrier remained in the same position.
Subjects were two of the authors (CC and JF) and two naive subjects (JC and PD). CC and JF were tested with auditory feedback as to the correctness of the response, while JC and PD were tested without feedback. All observers had normal or corrected to normal acuity and viewed the stimulus binocularly.
Results
Subjects’ performance on the 2AFC direction discriminaton task was measured for a range of displacements at two stimulus densities in each of three stimulus conditions. The percentage error as a function of displacement is shown in Figure 1A-F. Zero percent error indicates that the subject was able to report the correct direction of displacement with complete accuracy; 100% error corresponds to a consistent perception of direction in the reverse direction; 50% error indicates that the subject was unable to perceive a consistent direction of motion and was responding at chance. Data obtained using the sparse and dense stimuli are shown on the left and right of Figure 1, with Conditions 1-3 going from top to bottom.
For sparse stimulus presentation, results in all three conditions were very similar: below a displacement of 2.25![]() (half the centre-to-centre micropattern spacing), subjects reported the direction of motion with few or no errors; at a displacement of 2.25
(half the centre-to-centre micropattern spacing), subjects reported the direction of motion with few or no errors; at a displacement of 2.25![]() , error rates were around 50%; at displacements above 2.25
, error rates were around 50%; at displacements above 2.25![]() , subjects predominantly reported motion in the reverse direction. For the dense stimuli, results varied considerably between the three conditions. For three of the four subjects, the graphs of the data in Condition 1 (Figure 1D) have a cyclical appearance with peaks in percentage error at displacements of 1.0l and 2.0l and troughs at 1.5
, subjects predominantly reported motion in the reverse direction. For the dense stimuli, results varied considerably between the three conditions. For three of the four subjects, the graphs of the data in Condition 1 (Figure 1D) have a cyclical appearance with peaks in percentage error at displacements of 1.0l and 2.0l and troughs at 1.5![]() and 2.5-2.75
and 2.5-2.75![]() . The data from the fourth subject (JF) shows a monotonic rise in percentage error to a peak at 2.0
. The data from the fourth subject (JF) shows a monotonic rise in percentage error to a peak at 2.0![]() , and then drops in line with the other subjects. For the dense stimulus in Condition 2 (Figure 1E), all four subjects were able to discriminate the direction of motion accurately at small (up to 1.0
, and then drops in line with the other subjects. For the dense stimulus in Condition 2 (Figure 1E), all four subjects were able to discriminate the direction of motion accurately at small (up to 1.0![]() ) and large (2.5-3.0
) and large (2.5-3.0![]() ) displacements. At intermediate displacements error rates were close to 100%. For Condition 3, the results at short displacements (from 0.25-1.0
) displacements. At intermediate displacements error rates were close to 100%. For Condition 3, the results at short displacements (from 0.25-1.0![]() ) showed some intersubject variability, with one subject (JF) recording around 30% errors while for the others errors were around 50%. However, in the range from 1.25-2.25
) showed some intersubject variability, with one subject (JF) recording around 30% errors while for the others errors were around 50%. However, in the range from 1.25-2.25![]() all four subjects consistently perceived motion in the reverse direction.
all four subjects consistently perceived motion in the reverse direction.
The results for Condition 1 are consistent with those reported by Boulton and Baker [3]. In the dense case, they found that percentage error increased from zero at the shortest displacements to a peak of around 75% just below 1.0![]() , and then dropped back to around 5-10% for displacements greater than 1.0
, and then dropped back to around 5-10% for displacements greater than 1.0![]() . They did not report data for displacements greater than 1.5
. They did not report data for displacements greater than 1.5![]() . In the sparse case they reported data for displacements less than 2.0
. In the sparse case they reported data for displacements less than 2.0![]() . Their data showed errors of less than 10% for displacements less than 1.75
. Their data showed errors of less than 10% for displacements less than 1.75![]() , with slightly higher rates at larger displacements.
, with slightly higher rates at larger displacements.
Here, for all Conditions of the sparse stimulus, and Condition 2 of the dense stimulus, we find perceived direction is determined by the displacement of the Gaussian envelope. For displacements of less than half the average centre-to-centre micropattern spacing, or greater than the whole spacing, motion is perceived predominantly in the direction of displacement. Motion is generally perceived in the reverse direction for intermediate displacements. For sparse stimuli, this is the case whether the Gaussian envelope is defined by contrast or by luminance (compare Conditions 2 & 3, Figure 1BC). This is true for contrast envelopes whether or not the carrier is also displaced (compare Conditions 1 & 3, Figure 1AC). For the dense stimulus, however, we find that perceived direction is influenced by both the carrier (compare Conditions 1 & 3, Figure 1DF) and the nature of the envelope (compare Conditions 2 & 3, Figure 1EF).
COMPUTATIONAL MODELLING
Methods
We propose a two-channel model for the perception of first- and second-order motion. The first-order channel processes short-range motion information, while the second-order channel operates only at coarse resolution (long-range). The first-order channel analyses motion according to a simple first-order luminance-based scheme. In the second-order channel, the stimulus is first passed through a spatially and temporally low-pass filter and full-wave rectified. It is then analysed at coarse spatial resolution by a first-order mechanism identical to that used in the first-order channel. The first-order channel is insensitive to second-order motion, while the second-order channel responds to both first- and second-order stimuli. The architecture of the model is illustrated schematically in Figure 2.
The initial stage of processing common to both channels is the removal of the mean luminance of the stimulus, which is assumed to occur at the retinal level in the human visual system [15]. This mean zero signal serves as the input to the short-range motion detectors in the first-order channel.
The pre-processing stage in the second-order channel acts as a texture grabber [10], converting variations in the spatial and temporal frequencies of the image signal into variations in the magnitude of the pre-processed signal. Since the output of the second-order channel also varies with image contrast, it necessarily confounds spatial frequency and contrast by encoding their variations in a single response. Werkhoven et al. [17] provide psychophysical evidence that human perception of texture-defined motion is subject to the same confusion. Here we extend the spatial texture grabber proposed by Werkhoven et al. into the spatiotemporal domain by introducing a low-pass temporal filter.
Motion is extracted by a standard first-order motion energy computation [1] using Gabor filters in space and time. Gabor filters were chosen to provide a measure of the amount of motion information available from the stimulus, not necessarily as an accurate model of the motion analysis filters in the human visual system. While there is evidence of spatial filters with receptive fields resembling Gabor functions in the primary visual cortex [13], the visual system’s temporal filters will necessarily be causal and are likely to be better described by the modulation of an asymmetric temporal envelope than by a Gabor function [12].
Full details of the implementation of the model are given in the appendix.
Results & Discussion
Figure 3 shows the model’s responses to sparse and dense two-frame apparent motion stimuli in each of the three stimulus conditions. The direction index of the response from each channel of the model is shown as a function of displacement. A direction index of +1 denotes motion in the direction of displacement; -1 denotes reverse motion; 0 indicates no net motion. Details of the calculation of the direction index are given in the Appendix. The layout of Figure 3 corresponds to that of Figure 1, with sparse and dense cases on the left and right and Conditions 1-3 going from top to bottom. Data points from the first-order channel are represented by circles, second-order by squares. To facilitate comparisons with the psychophysical data, solid lines are used to graph the response of the first-order channel to sparse stimuli and of the second-order channel to dense stimuli.
For the sparse stimulus, results from the second-order channel in all three conditions are nearly identical: the direction index is close to 1 up to a displacement of 2.0![]() , and then changes smoothly, being exactly 0 at a displacement of 2.5
, and then changes smoothly, being exactly 0 at a displacement of 2.5![]() and nearly -1 at a displacement of 3.0
and nearly -1 at a displacement of 3.0![]() . The behaviour of the second-order channel can be understood as establishing the shortest path of correspondence between micropatterns in successive frames. At short displacements, the second-order channel recovers motion in the veridical direction, but at displacements greater than half the average centre-to-centre spacing of the micropatterns the shortest correspondence path is actually in the opposite direction, and the second-order channel thus recovers reverse motion. The texture grabbing operation preceding motion detection in the second-order channel renders it insensitive to the fine structure of the micropatterns, hence the close similarity between the results across the three stimulus conditions.
. The behaviour of the second-order channel can be understood as establishing the shortest path of correspondence between micropatterns in successive frames. At short displacements, the second-order channel recovers motion in the veridical direction, but at displacements greater than half the average centre-to-centre spacing of the micropatterns the shortest correspondence path is actually in the opposite direction, and the second-order channel thus recovers reverse motion. The texture grabbing operation preceding motion detection in the second-order channel renders it insensitive to the fine structure of the micropatterns, hence the close similarity between the results across the three stimulus conditions.
The results from the first-order channel differ greatly between the three sparse conditions. For Condition 1 (Figure 3A), the graph of the data from the first-order channel has a cyclical form with peaks at displacements of 0.75![]() , 1.75
, 1.75![]() , and 2.75
, and 2.75![]() and troughs at 0.25
and troughs at 0.25![]() , 1.25
, 1.25![]() , and 2.25
, and 2.25![]() , with the signalled direction of motion depending principally on the shortest correspondence path for the carrier. For Condition 2 (Figure 3B), the data from the first-order channel are quite similar to those for the second-order channel: since there is no carrier, the direction of recovered motion depends on the centre-to-centre spacing of the micropatterns . For Condition 3 (Figure 3C), the direction index varies smoothly from around -0.5 at small displacements to around 0 at large displacements.
, with the signalled direction of motion depending principally on the shortest correspondence path for the carrier. For Condition 2 (Figure 3B), the data from the first-order channel are quite similar to those for the second-order channel: since there is no carrier, the direction of recovered motion depends on the centre-to-centre spacing of the micropatterns . For Condition 3 (Figure 3C), the direction index varies smoothly from around -0.5 at small displacements to around 0 at large displacements.
For the dense stimulus, the results from both channels differ between the conditions. In Condition 1, the response of the first-order channel varies cyclically with peaks in direction index at displacements of 0.75-1.0![]() and 2.0-2.25
and 2.0-2.25![]() and troughs at displacements of 0.25-0.5
and troughs at displacements of 0.25-0.5![]() , 1.5-1.75
, 1.5-1.75![]() , and 2.75-3.0
, and 2.75-3.0![]() . The first-order motion energy in the stimulus of Condition 1 is determined principally by the motion of the carriers, although the presence of the envelope and/or phase differences between the carriers causes the first-order channel’s behaviour to deviate from the simple dependence on carrier wavelength seen for the corresponding sparse stimulus. The direction index of the response from the second-order channel is positive at small (<1.25
. The first-order motion energy in the stimulus of Condition 1 is determined principally by the motion of the carriers, although the presence of the envelope and/or phase differences between the carriers causes the first-order channel’s behaviour to deviate from the simple dependence on carrier wavelength seen for the corresponding sparse stimulus. The direction index of the response from the second-order channel is positive at small (<1.25![]() ) and large (>2.25
) and large (>2.25![]() ) displacements, and negative at intermediate displacements, determined by the centre-to-centre spacing of the micropatterns. For Condition 2, the results given by the two channels are very similar to one another: positive at short and long displacements and negative in between, consistent with the shortest correspondence path between micropatterns. For Condition 3, the direction index of the first-order channel is close to -1 for displacements of 0.25-2.25
) displacements, and negative at intermediate displacements, determined by the centre-to-centre spacing of the micropatterns. For Condition 2, the results given by the two channels are very similar to one another: positive at short and long displacements and negative in between, consistent with the shortest correspondence path between micropatterns. For Condition 3, the direction index of the first-order channel is close to -1 for displacements of 0.25-2.25![]() , and near +1 for displacements of 2.75
, and near +1 for displacements of 2.75![]() and 3.0
and 3.0![]() . For the second-order channel, the direction index is positive for displacements less than 1.75
. For the second-order channel, the direction index is positive for displacements less than 1.75![]() and greater than 2.5
and greater than 2.5![]() , and small and negative in between.
, and small and negative in between.
For all three conditions of the sparse stimulus, the response of the model’s second-order channel has qualitatively the same form as the psychophysical data (compare solid lines, Figure 3A-C with Figure 1A-C). The response of the first-order channel, however, bears no relation to the psychophysical data except in Condition 2, where it is very similar to the response of the second-order channel. We suggest that subjects’ perception of direction in the sparse stimuli is mediated by a second-order channel of the form implemented in the proposed model.
For the dense stimulus, the situation is a little more complicated. Of the two channels, the response of the first-order (Figure 3D-F, solid line) more closely resembles the psychophysical data. However, there are two principal discrepancies. Firstly, the model’s first-order channel has an almost perfectly periodic response in Condition 1 (Figure 3D, solid line), with direction indices near +/-1 at all peaks and troughs, while the amplitude of the cyclical variations in the psychophysical data appears to increase with displacement (![]() ) has a direction index near -1, corresponding to motion in the reverse direction (Figure 3F, solid line), while the psychophysical subjects were unable to report a consistent direction of motion (Figure 1F). Interestingly, in the regions where there are discrepancies between the first-order channel and the data, we notice that the psychophysical data lies somewhere between that from the simulations of the first- and second-order channels. This leads us to suggest that the psychophysical subjects are basing their responses on the outputs of both a first- and a second-order channel. Furthermore, the data from subject JF more closely follows the trends predicted by the second-order channel than do the data of the other three subjects, suggesting that the relative contributions of the putative first- and second-order channels to judgements of direction in the dense stimuli might be interindividually variable. Future work with a larger number of subjects is planned to investigate interindividual differences in the perception of second-order motion.
) has a direction index near -1, corresponding to motion in the reverse direction (Figure 3F, solid line), while the psychophysical subjects were unable to report a consistent direction of motion (Figure 1F). Interestingly, in the regions where there are discrepancies between the first-order channel and the data, we notice that the psychophysical data lies somewhere between that from the simulations of the first- and second-order channels. This leads us to suggest that the psychophysical subjects are basing their responses on the outputs of both a first- and a second-order channel. Furthermore, the data from subject JF more closely follows the trends predicted by the second-order channel than do the data of the other three subjects, suggesting that the relative contributions of the putative first- and second-order channels to judgements of direction in the dense stimuli might be interindividually variable. Future work with a larger number of subjects is planned to investigate interindividual differences in the perception of second-order motion.
Comparison of the psychophysical data and computational simulations suggests that perceived direction of motion in the sparse stimuli is mediated principally by a second-order motion mechanism, while for the dense stimuli both first- and second-order channels are involved. Why might the output of the second-order channel dominate for sparse stimuli but not for dense? We propose that the relative significance of the two channels’ responses in determining the perceived direction of motion depends upon the relative magnitudes of the two channels’ responses. In the model, we take as a metric of a channel’s response its motion energy response summed over forward and reverse directions. This measure is independent of the direction index, as it depends upon the total motion energy regardless of direction. Direct comparisons cannot be made between the response magnitudes of the two channels as they are computed independently. The level of the response of the second-order channel depends upon the gain of the filters which pre-process the image as well as on the motion detection mechanism itself, and thus the absolute values of the responses of the first- and second-order channels cannot be compared. For this reason we look at the ratio of the response magnitudes of the first- and second-order channels (shown in Figure 4 for each of the six stimulus types). The values on the y-axis of Figure 4 may be scaled arbitrarily, corresponding to changing the gain of the texture grabber, without affecting the form of the graph.
We see from Figure 4 that, for Conditions 1 and 3, the ratio of the response of the first- to the second-order channel is higher for the dense stimulus (filled squares and circles) than for the sparse (corresponding unfilled symbols). This is consistent with our suggestion that the perceived direction of motion in the dense stimuli reflects the responses of both channels, while motion perception in the sparse stimuli is governed by the second-order channel. The response ratios for both the dense and sparse stimuli in Condition 2 are lower than for the sparse stimulus in Conditions 1 and 3, suggesting that the response of the second-order channel determines perceived direction for both stimulus densities in Condition 2. However, the direction indices of the responses of the two channels to the stimuli in Condition 2 are very similar, so this latter point cannot be tested experimentally.
CONCLUSION
A two-frame motion stimulus was used to examine human perception of motion from first- and second-order cues. The psychophysical data obtained were modelled using a variant of the two-channel models proposed by Chubb and Sperling [9] and Wilson et al [18]. The concordance between our model simulations and the psychophysical data suggests that distinct mechanisms exist for the fine scale analysis of luminance-based motion and the coarse scale analysis of texture-based motion, with the relative activities of the two channels determining which mediates the perception of motion for a given stimulus.
An interesting possibility proposed recently by Taub et al [16] is that the parallel motion processing pathways contain the same basic computational units and differ only in the scale at which they operate. If motion extraction is preceded at all scales by an asymmetric nonlinearity, then Taub et al speculate that the effective balance of the linear and nonlinear contributions might vary over scale, giving rise to apparent differences in the linearity of pre-processing between coarse and fine scales. A model with such an architecture has the attraction of parsimony, and cannot be discounted on the basis of our data.
Acknowledgements
This work was supported by NIH Grant EY-2ROI-0781-06 to LMV, and an NSF REU Grant to the Biomedical Engineering Department of Boston University for JNF. We thank Jane Boulton for providing the algorithm for the Boulton & Baker test, and Junzhen Lu and Jose Diaz for programming support.
APPENDIX: IMPLEMENTATION OF MODEL AND SIMULATIONS
The intial pre-processing stage common to both first- and second-order channels is the removal of the mean luminance, or DC component, of the stimulus. The mean is calculated over the entire image on a frame-by-frame basis. The signal in the first-order channel is then operated upon directly by the motion energy detectors.
Texture grabbing
Prior to the extraction of second-order motion, the image signal is pre-processed by a texture grabber. The operation of the texture grabber consists of three stages: initial linear filtering, full-wave rectification, and further linear filtering. Here, the first stage is low-pass filtering in space and time using a space-time separable filter. The spatial filter is a two-dimensional Gaussian, G(x,y):

The spatial extent of the filter is governed by the parameter, s, which here is set to 0.8 pixels. The two-dimensional Gaussian is itself separable into two one-dimensional Gaussians, so spatial filtering is carried out by successive convolution with two 3×1 masks. The spatial convolution wraps around at the edges of the image. The temporal filter, E(t), is a first-order low-pass filter with an impulse response which decays exponentially over time:
where t is the time constant. The value of t is necessarily positive, and gives a measure of the duration of temporal support. Here, t is set to 0.5 frames. For efficiency, temporal filtering is implemented recursively using the following recursion relation:
![]()
where T represents time sampled discretely in frames, I(T) is the input to the filter at time T, O(T) is the output of the filter, and b is a constant given by:
![]()
(For a derivation of the recursion relation see [11]).
The signal is then full-wave rectified and the mean removed. As above, the mean is calculated over the entire image on a frame-by-frame basis. The signal is then subsampled by a factor of two in both spatial dimensions, and spatial and temporal filtering repeated with the same filters. The fact that the signal has been spatially subsampled means that convolution with the same filter kernels as previously represents spatial filtering at a coarser scale. The signal is then spatially subsampled and low-pass filtered in space and time once more before being input to the motion energy detectors.
Motion energy computation
Motion energies are computed from the outputs of quadrature pairs of filters oriented in space-time. Here, sine and cosine phase Gabor filters are used to approximate quadrature. The initial stage of filtering involves spatiotemporally separable filters, with space-time kernels, Y(x,y,t), given by:
![]()
where sx, sy and st define the extent of the three-dimensional Gaussian envelope, kx and w are the spatial (horizontal) and temporal carrier frequencies, and fx and ft define the phase of the carrier relative to the envelope. Here, the preferred spatial and temporal frequencies, kx and w, of the filters are set to 0.1 pixels and 0.1 frames respectively, giving a carrier vertically oriented in space. The values of sx, sy are 2.5 pixels, and st is 2.5 frames, implemented in 15×1 convolution masks. The phases, fx and ft, are set to either 0 or p/2 to give the cosine and sine members of each quadrature pair. The outputs of these filters are then combined using trigonemetrical identities to give space-time oriented filters (see [1]).
Direction index
The direction index is calculated as a summary statistic of the directional responses of the horizontal motion detectors. The direction index is used to facilitate comparison of the output of the model with the response of psychophysical observers. A direction index of +1 denotes horizontal motion unambiguously in the correct direction, -1 unambiguously in the opposite direction, and 0 totally ambiguous motion or no net motion. To convert the responses of the model into a formal psychophysical decision would require additional assumptions about the neural substrate of perceptual decisions (see [5]).
A local directional response, D(x,y,t), is calculated for each point from the leftwards and rightwards motion energies, L(x,y,t) and R(x,y,t), according to the following equation:
![]()
where a is a constant given a small positive value to condition the quotient. The value of a is set at 10-7. If a was given a large value then this would qualitatively affect the form of D(x,y,t), as with low motion energies the directional response would be biased towards zero. However, in the simulations here the value of a was not manipulated as a parameter but fixed at a low value purely to prevent arithmetic exceptions in the execution of the model software.
Leftwards and rightwards motion energies are calculated for each point in the ninth frame of the pre-processed image sequence. The ninth frame was chosen to minimise temporal edge effects from the beginning and end of the image sequence. To obtain a single direction index from the output of the model, the signed directional responses are simply summed over space and divided by the sum of their moduli to give a number between ±1. This value is multiplied by the sign of the correct response (leftwards defined as positive) to convert from a left-right index into a correct-incorrect index:

Stimulus parameters
Stimuli for the model simulations are sequences of 128×128 images of 16 frames duration. The Gabor array stimulus is constructed as follows. The first image in the two image sequence consists of three rows of Gabor patterns, P(x,y):
![]()
The Gabor functions have a carrier wavelength, lambda = 2pi/kx, of 8.0 pixels and the standard deviation, s, of the Gaussian envelope is 6.0 pixels. The centre-to-centre spacing of the Gabor patterns is 20.0 pixels in the dense condition, and 40.0 in the sparse. These values are in direct proportion to those used in the psychophysical experiments. The first image is present for 8 frames. The second image is simply a shifted version of the first, with wraparound at the edges, again presented for 8 frames. Jittering the positions of the micropatterns was found to affect the value of the direction index by a negligible amount (<0.05), so the simulations were run without jitter.
REFERENCES
1 Adelson, E.H. and Bergen, J.R., Spatiotemporal energy models for the perception of motion, Journal of the Optical Society of America, A, 2 (1985) 284-299.
2 Boulton, J. B. and Baker, C. L., Motion detection is dependent on spatial frequency not size”, Vision Res., 31 (1991) 77-87.
3 Boulton, J. B. and Baker, C. L., Different parameters control motion perception above and below a critical density, Vision Res., 33 (1993) 1803-1811.
4 Braddick, O.J., A short range process in apparent motion, Vision Res., 14 (1974) 519-527.
5 Britten, K.H., Shadlen, M.N., Newsome, W.T. and Movshon, J.A., The analysis of visual motion: A comparison of neuronal and psychophysical performance, J.Neuroscience, 12 (1992) 4745-4765.
6 Cavanagh, P., Short range vs long range motion: Not a valid distinction, Spatial Vision, 5 (1991) 303-309.
7 Cavanagh, P. and Mather, G., Motion: The long and the short of it,Spatial Vision, 4 (1989) 103-129.
8 Chubb, C. and Sperling, G., Drift-balanced random stimuli: A general basis for studying non-Fourier motion perception, Journal of the Optical Society of America, A, 5 (1988) 1986-2006.
9 Chubb, C. and Sperling, G., Two motion perception mechanisms revealed through distance-driven reversal of apparent motion,Proceedings of the National Academy of Sciences, U.S.A., 86 (1989) 2985-2989.
10 Chubb, C. and Sperling, G., Texture quilts: Basic tools for studying motion-from- texture, Journal of Mathematical Psychology, 35 (1991) 411-442.
11 Clifford, C.W.G., Ibbotson, M.R. and Langley, K., An adaptive Reichardt detector model of motion adaptation in insects and mammals,Visual Neuroscience, 14 (1997) 741-749.
12 Johnston, A. and Clifford, C.W.G., A unified account of three apparent motion illusions, Vision Res., 35 (1995) 1109-1123.
13 Lu, Z.-L. & Sperling, G., The functional architecture of human visual motion perception, Vision Res., 35 (1995) 2697-2722.
14 Pollen, D. A. and Ronner, S. F., Phase relationships between adjacent simple cells in the visual cortex, Science, 212 (1981) 1409-1411.
15 Shapley, R. and Enroth-Cugell, C., Visual adaptation and retinal gain controls, Progress in Retinal Research, B3 (1984) 263-346.
16 Taub, E., Victor, J. D. & Conte, M.M., Nonlinear processing in short-range motion, Vision Res., 37 (1997) 1459-1477.
17 Werkhoven, P., Sperling, G. and Chubb, C., The dimensionality of texture- defined motion: a single channel theory, Vision Res., 33 (1993) 463-485.
18 Wilson, H.R., Ferrera, V.P. and Yo, C., A psychophysically motivated model for two-dimensional motion perception, Visual Neuroscience, 9 (1992) 79-97.