HOME Cell Help
The Health Outcomes Monitoring and Evaluation (HOME) Cell allows users to define a population of interest and then assess the health status or an outcome of interest of that population over time.
The HOME Cell can be used by researchers in hypothesis development, to investigate whether the MHDR database contains enough patients with their particular facts of interest to assess the research question, or as a push-button health status monitoring system.
NOTE: Before you can utilize the HOME Cell you must have already generated a query in the Query Tool that will be your Initial Population for the HOME Cell Query.
The Components of the HOME Cell
1. The Start Tab – In the Start Tab users may choose to begin a New Query, load an existing i2b2 HOME Query from the workspace, or import an External File that contains XML code to generate their query.
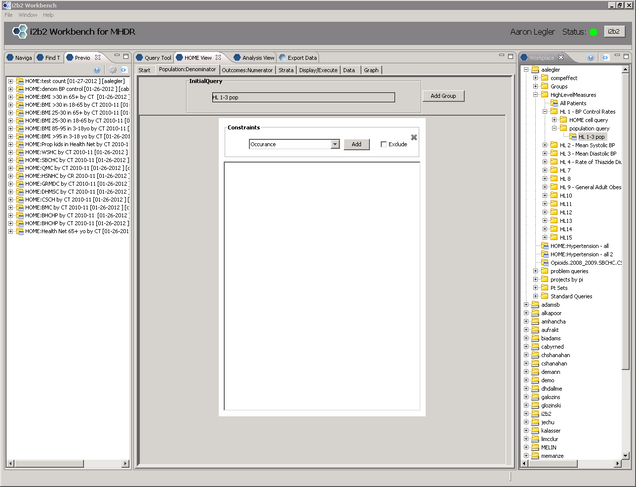
2. Population: Denominator Tab – The Population:Denominator tab is used to define the initial starting denominator for the query. To begin, drag a pre-existing i2b2 Query into the Initial Query field. The name of the Query will display once it is loaded. Note: You cannot place a pre-existing HOME Cell query here.
Once the initial denominator is defined, users may further refine that denominator by applying constraints and a reference interval as detailed below.
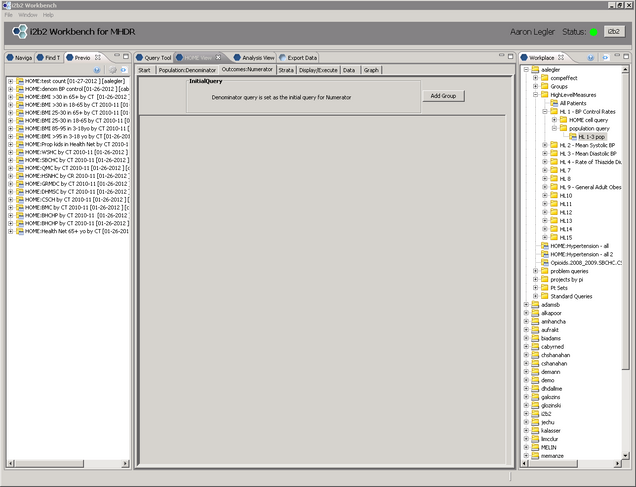
3. Outcomes: Numerator Tab – Once the population has been refined in the Denominator tab, the Numerator tab is used to either further refine the Numerator. Depending on your question of interest, further constraints may be added, however the analysis can be run without adding anything to the Numerator tab if you so choose.
4. Strata Tab – Stratifications in the MHDR i2b2 system are pre-defined as Queries by the user. Queries can be saved to be used again as stratifications, and many are already stored in the Workspace Shared Folder (Shared -> Strata).
Stratifications may be done by either fixed characteristics (Race, Gender, etc.) or by non-fixed characteristics (Age, Insurance, Vitals, Language, Census Tract, Marital Status, Diagnosis, etc.)
Whether your strata are fixed or not is am important consideration when generating the Queries that will be used to define them.
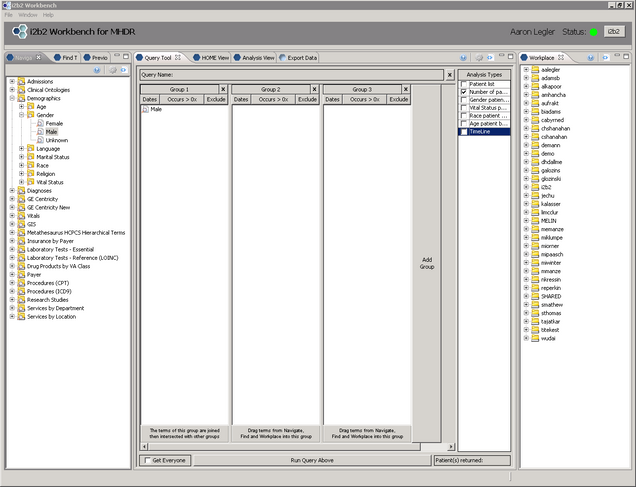
Fixed characteristics such as Gender would require one query for eachstrata:
- Query 1: Group 1 – Male
- Query 2: Group 1 – Female
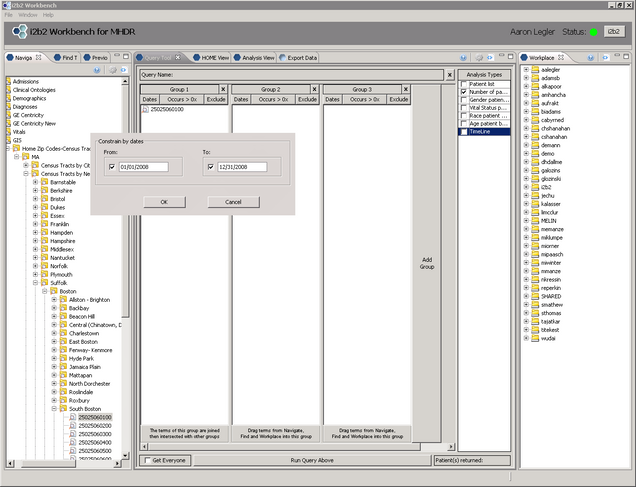
Non-fixed characteristics such as census tract are subject to change overtime (patients who live in one census tract now may not necessarily have livedthere forever) so it is recommended to setup your strata to account for thesechanges, either by restricting your Query to patients who have lived in that census tract over a reasonably short timeperiod:
- Group 1 – Census Tract 25025060100 Dates: 01/01/2008-12/31/2008
Or restricting the Query to patients who have ONLY lived in that census tract so the strata become mutually exclusive:
- Group 1 – Census Tract 25025060100
- Group 2 – Exclude All Other Census Tracts
Strata are a powerful tool to examine differences between subsets of the same population, however poorly defined strata may provide un-interpretable results or worse a seemingly valid result that is actually just an artifact of the stratification method.
5. Display/Execute Tab – The Display/Execute tab allows the user to select the outcome of interest as well as now set the reference interval if desired. Outcomes available in the HOME Cell are Percent, Count, and Average.
- Percent calculates the proportion of patients defined in the Denominator tab that are also captured in the Numerator tab.
- Count calculates the number of occurrences of a concept for the population defined bythe Denominator and the population further refined by the Numerator. Filtering is also available for quantitative concepts such as lab values or blood pressure readings.
- Average calculates the Average of either the overall Average or the most Recent value for a quantitative concepts for both the Denominator and the Numerator populations. Filtering is also available.
Note: If Count or Average is selected the Denominator and Numerator will be further refined to include only patients with that particular concept in the time interval.
6. Data Tab – After the HOME Cell query has completed, the results will be displayed in a tabulated format in the Data tab. Depending on the analysis you chose, different column headers will be displayed.
| Column Header | Definition | Percent | Average | Count |
| Strata | The Strata applied in the Strata Tab | √ | √ | √ |
| Interval |
The Interval defined in the Display/Execute
Tab
|
√ | √ | √ |
|
SD
SN
SDXN
|
Count of patients in the Denominator, the Numerator, or the Denominator Excluding the Numerator | √ | √ | |
| SN/SD | Count of patients in the Numerator divided by the count of patients in the Denominator (result shown as %) | √ | ||
| SDXN/SD | Count of patients in the Denominator Excluding the Numerator divided by the count of patients in the Denominator (result shown as %) | √ | ||
|
SDAvg
SNAvg
SDXNAvg
|
Average of the numeric Concept being measured for either the Denominator, Numerator, or Denominator Excluding the Numerator | √ | ||
|
SDStDv
SNStDv
SDXNStDv
|
Standard Deviation of the numeric Concept being measured for either the Denominator, Numerator, or Denominator Excluding the Numerator | √ | ||
|
SDPtCount
SNPtCount
SXNPtCount
|
Patient count for the Denominator, Numerator, or Denominator Excluding the Numerator | √ | ||
|
SDCount
SNCount
SDEXNCount
|
Count of the Concept being measured for the Denominator, Numerator, or Denominator Excluding the Numerator | √ |
Tabulations from the Data tab may be exported by selecting Save As in the lower right hand corner of the Data Tab.
7. Graph Tab – The data will also be presented in a graphical format in the Graph tab. Right mouse click on the graph allows the user to modify the graph as well as export it as a static image file.
Constraints
Within the Population: Denominator and Outcomes: Numerator tabs constraints can be applied to further refine your sample of interest. The available constraints are Occurrence, Value, and Age constraints. Just as in the Query module, OR statements exist in the same Group in the HOME cell query while AND statements exist in a separate Group.
Occurrence Constraints link concepts spatially in time to occur within a defined Reference Interval, or link two concepts to occur in some relation to one another and within the Reference Interval.
Occurrence constraints may be applied in 3 ways:
- Concept 1 Independent – Concept 1 or the Concept 1 Interval occurs within the Reference Interval
- Concept 1 Follows Concept 2 – Concept 1 occurs after Concept 2 and either Concept may be linked to the Reference Interval
- Concept 1 Precedes Concept 2 – Concept 1 occurs before Concept 2 and either Concept may be linked to the Reference Interval
When applying an Independent Occurrence constraint you may then apply the Reference Interval to the Concept or the Concept Interval.
The Reference Interval is a linear stratification of time that is defined on the Display/Execute tab. For any constraints applied in the Population:Denominator or Outcomes:Numerator tab the reference interval can be applied to the concepts in that constraint. The system will then report the data stratified by occurrences of those constraints within the timeframe of the reference interval (Year, Month).
The Concept Interval is the duration of time between the Start_Date and the End_Date of a concept. Most modules within i2b2 and the HOME Cell utilize only the Start_Date, however some (including the Occurrence Constraint Concept Interval) use both.
Applying the Reference Interval to the Concept will count patients whose Concept Start_Date occurs within the Reference Interval.
Applying the Reference Interval to the Concept Interval will count patients where:
- the Concept Start_Date or End_Date, or both occur within the Reference Interval
- the Concept Start_Date occurs prior to the reference interval and the End_Date occurs after the reference interval

The diagram above details how different patients will or will not be counted by the HOME cell based on the application of the Reference Interval to the Concept or the Concept Interval.
When applying Occurrence Constraints between two Concepts, consider the two following statements:
- Patients with blood pressure following a diagnosis of hypertension by at least 1 day
- Patients with blood pressure following a diagnosis of hypertension by at least 1 day and no more than 365 days
In the first statement, the intent is to capture patients with a blood pressure that follows a diagnosis of hypertension by one day or more. You don’t care if the blood pressure was 1 day, 5 days, or 5 years following the diagnosis of hypertension. One way to capture this in the Denominator Tab would be to apply an occurrence constraint as follows:
Concept 1 [Blood Pressure] follows Concept 2[Essential Hypertension] by [min][1] Days
If you are planning to look at your query stratified by time (Year, Month) then you would also include:
Apply reference interval to:[Concept1]
You would only apply the reference interval to Concept1 because you only want to assess the blood pressures stratified by time period, and not necessarily the diagnosis.
For the second statement, you are trying to capture patients with a blood pressure that occurs at least 1 day after a diagnosis of essential hypertension but not more than 1 year after. So you would capture that as follows:
Concept 1 [Blood Pressure] follows Concept 2[Essential Hypertension] by [min][1] Days apply reference interval to:[Concept1]
Add Group (AND)
Concept 1 [Blood Pressure] follows Concept 2[Essential Hypertension] by [max][365] Days apply reference interval to:[Concept1]
Age Constraints will restrict the query to only certain age ranges, however the Age must be tied to some other concept, in this case the Blood Pressure would be a logical choice.
If you took the above query, but only wanted to examine patients 18 years or older within each year you would keep your current groups, and add another group:
Add Group (AND)
Age [>=][18][years] at [Blood Pressure] apply reference interval to [Concept]
The Reference Interval is applied to make sure the concept [Blood Pressure] occurs in that year, which also ties the Age into that same timeframe.
Value Constraints may be applied to the Average, Min, Max, Earliest, Latest or Sum of any numeric concept (blood pressure, BMI, laboratory values, etc.) or to the Text Value of any Character Field Concept (Diagnoses = Problem, Primary, Secondary, etc.).
The Value constraint can be calculated Independently, or can be further defined to be Preceding or Following the First or Latest occurrence of another concept by a Min or Max number of days. The Value can also be Filtered to include only values with a certain range of values.
Imagine you wanted to study only patients whose most recent Systolic BP was <140 and most recent Diastolic BP was <90, including only BP readings that followed their first diagnosis of hypertension, and exclude any blood pressures less than 30 or greater than 300 mmHg.
Latest][Systolic Blood Pressure][Following][First][Essential Hypertension] by [Min][1] days [<][140]
apply reference interval to [Value]
Filter In Values [Between] [30] to [300]
Add Group (AND)
Latest][Diastolic Blood Pressure][Following][First][Essential Hypertension] by [Min][1] days [<][90]
apply reference interval to [Value]
Filter In Values [Between] [30] to [300]
One note for this particular example – blood pressures in the MHDR are stored as separate Systolic and Diastolic values. Generally the values would occur simultaneously, however due to the inherent variability inherent of clinical data there could be a Systolic without an accompanying Diastolic or one of the values could be filtered out. In this instance the system would be evaluating a Systolic/Diastolic pair that did not occur together.


