Bruce T. Anderson, Department of Geography and Environment, Boston University
Renellys Perez, University of Miami/Cooperative Institute of Marine and Atmospheric Studies, NOAA
Katia Oleinik, Scientific Computing and Visualization, Boston University
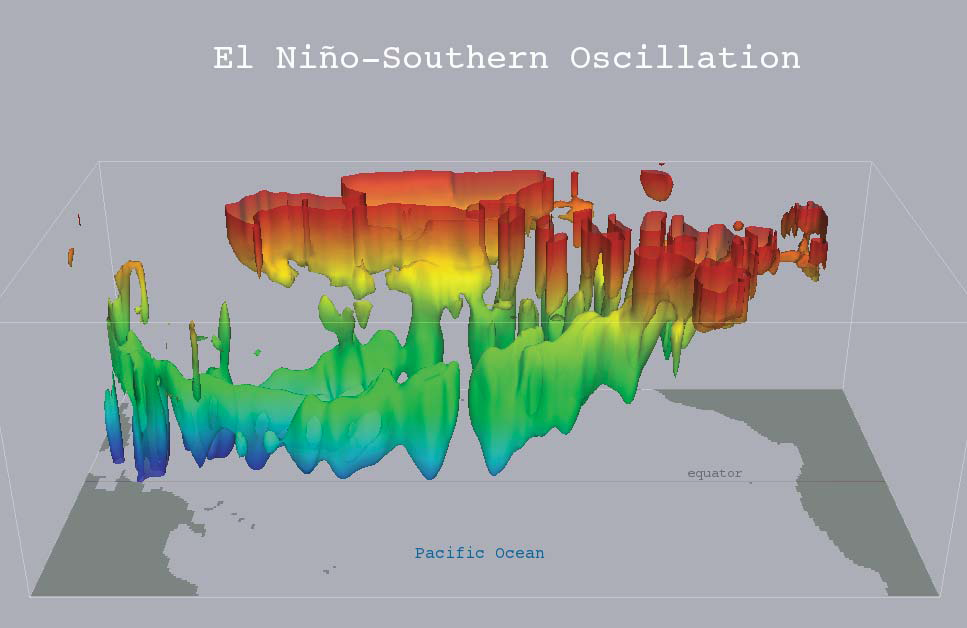
The El Niño/Southern Oscillation (ENSO)—which represents a coupled mode of ocean/atmosphere variability in the equatorial Pacific—imposes wide-spread changes to regional climates, with significant physical, biological, and socio-economic impacts in both hemispheres of the globe. Evidence from high-resolution observationally-constrained ocean data suggest that warm ENSO events (El Niños) can be initiated by modifications to the sub-surface equatorial Pacific Ocean temperatures in response to a weakening of central Pacific trade winds induced by northern hemisphere sea-level pressure variations. To ascertain the importance of anomalous atmospheric forcing in generating the surface and sub-surface temperature evolution of the ocean, the wind-stress and heat flux anomaly fields during the middle of Boreal winter are composited for years with negative sea-level pressuresover Hawaii. These anomaly fields are then used to force a high-resolution dynamical ocean model centered on the equatorial Pacific basin, using a ramp-up/ramp-down technique in which the full forcing fields are added to the climatological fields and persisted for the period December-March. The ocean model is then allowed to evolve over the next 3 months in an unforced mode.
In response to the imposed forcing, sub-surface temperature anomalies first develop along the offequatorial central North Pacific in mid-December. As these intensify, additional sub-surface anomalies form over the equatorial Pacific near the dateline, as well as in the off-equatorial central South Pacific. Subsequently, the equatorial and near-equatorial sub-surface temperature anomalies strengthen and propagate eastward along the thermocline, reaching the eastern equatorial Pacific by March 1, when they start to warm the surface waters. After the cessation of wind-stress and heat-flux forcing at the end of March, the sub-surface temperature anomalies in the central Pacific begin to dissipate, however their continued eastward propagation along the thermocline results in an intensification of the sea-surface temperature anomalies through May and June. Many of these features—including the initial sub-surface temperature anomalies in the western and central tropical Pacific and the subsequent emergence and intensification of surface temperature anomalies in the eastern equatorial Pacific—are found in the observationally-constrained ocean data as well. Overall, these findings highlight that extra-tropical atmospheric variability can initiate conditions leading to the onset and subsequent maturation of warm ENSO events up to twelve months later.
Visualization Sequence
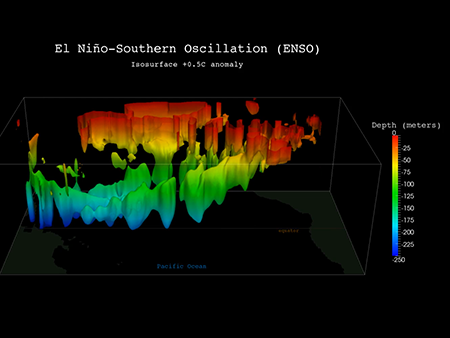
This time-lapse movie shows the evolution of the tropical Pacific Ocean temperatures in response to the wind-stress and heat-flux forcings described above.