“Small is Beautiful”: A New Era in China’s Overseas Development Finance?

After providing a staggering amount of finance for overseas development projects in the wake of the global financial crisis, Chinese overseas development finance has been on a general downward trend for several years.
What is the status of China’s overseas development finance in the COVID-19 era? And looking forward, how likely is China to return to large scale lending levels?
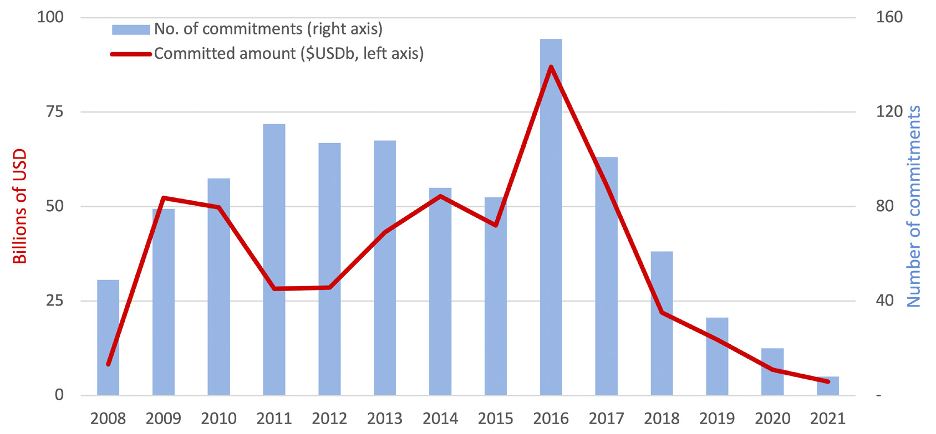
The China’s Overseas Development Finance (CODF) Database, managed by the Boston University Global Development Policy Center, recorded 28 new loan commitments in 2020 and 2021 worth a combined value of $10.5 billion, the lowest in recent years.
A new policy brief shares insights on the state of China’s overseas development finance from 2008-2021 and how borrowers, sectors and loan types have changed over the years.
Figure 1: China’s Overseas Development Finance by Year, 2008-2021
Launched in 2020, the CODF Database is the first global, harmonized, validated and geolocated record of Chinese overseas development finance. It covers the years 2008-2021 and includes loan commitments from China’s two main development finance institutions (DFIs), the China Development Bank (CDB) and Export-Import Bank of China (CHEXIM), to governments, inter-governmental bodies, majority state-owned entities and minority state-owned entities with sovereign guarantees.
Main findings:
- Total number of loan commitments: The CODF Database records a total of 1,099 Chinese overseas development finance commitments made to 100 countries, totaling $498 billion between 2008-2021. This level of lending (83 percent of World Bank sovereign lending during these years) places China’s DFIs among the most active DFIs in the world. Loans have been made on nearly every continent, with concentrations in Southeast Asia, Africa and South America.
- The “small is beautiful” approach to lending: As Chinese overseas development finance has fallen in total value, so too has the average loan commitment size, both in monetary value and in the geographic footprint of financed projects. This trend is emblematic of the “small is beautiful” approach to Chinese economic engagement in recent years, which prioritizes smaller and more targeted projects.
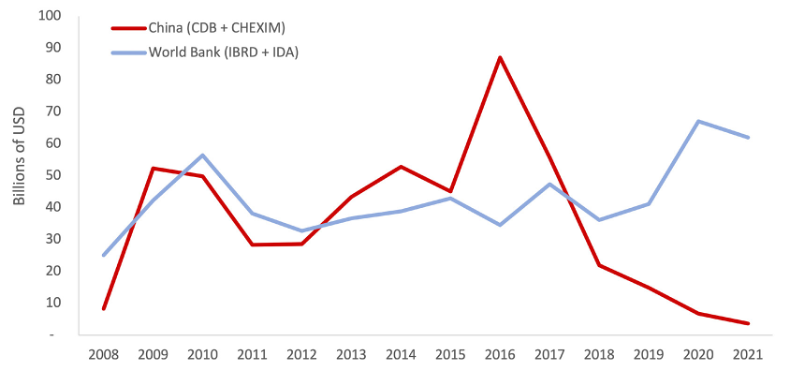
- Chinese overseas development finance lending compared with the World Bank: From 2008-2021, Chinese DFIs committed $498 billion in development finance, or approximately 83 percent of the $601 billion lent by the World Bank in the same years through their sovereign lending windows, the International Bank for Reconstruction and Development (IBRD) and International Development Association (IDA).
Figure 2: Development Lending Commitments by China’s DFIs and the World Bank
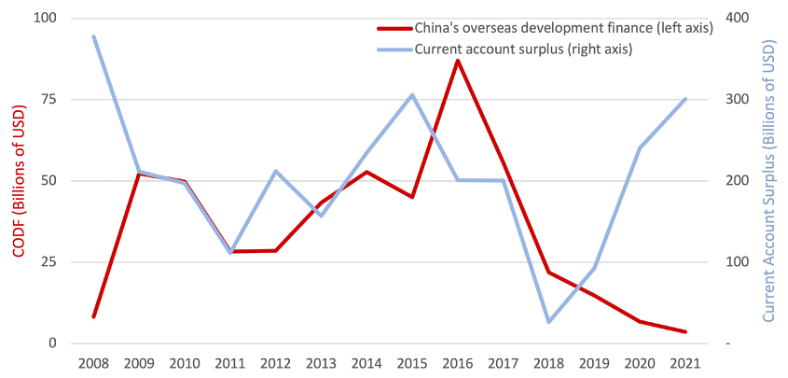
- China’s overseas development finance and its current account surplus: From 2009-2018, China’s overseas development loan commitments were strongly correlated with China’s current account surplus, which supplied foreign currency that could then be leveraged through sovereign finance. In recent years, however, China’s development finance has fallen while its current account surplus has rebounded.
Figure 3: China’s Overseas Development Finance and Current Account Surplus, 2008-2021
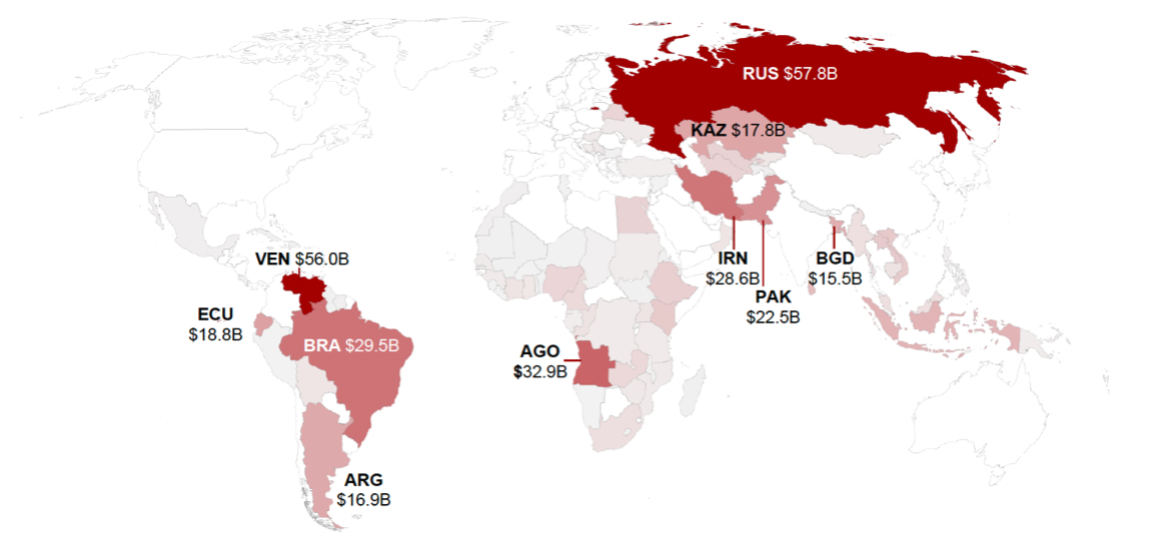
- Top ten borrowers: China’s development finance has been concentrated among its top ten borrowers — Angola, Argentina, Bangladesh, Brazil, Ecuador, Iran, Kazakhstan, Pakistan, Russia and Venezuela — which account for $296.3 billion, or 59 percent, of total loan commitments.
Figure 4: Geographic Distribution of Chinese Overseas Development Finance Commitments, Total, 2008-2021
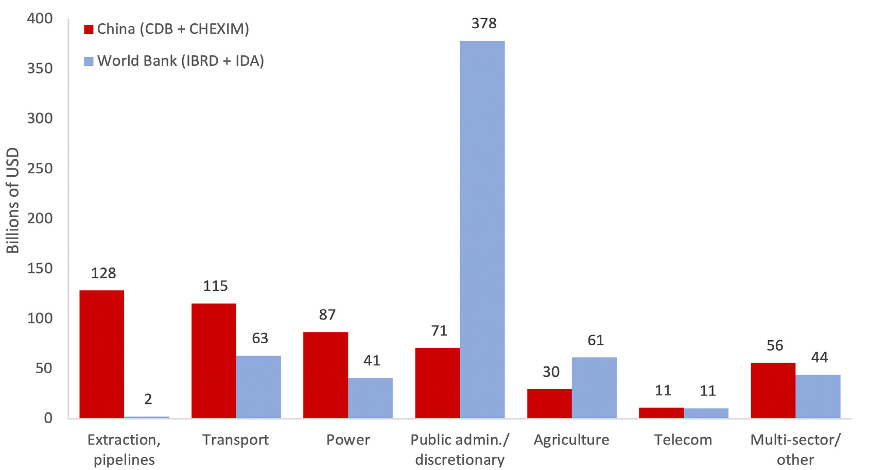
- Top three sectors: The top three sectors for China’s development finance are extraction and pipelines, transport and power, accounting for $331 billion, or 66 percent, of total loan commitments.
- Changes in sectoral focus: Since 2018, China’s overseas development finance has shifted away from general lending for state-owned enterprises (SOEs) and public-private partnerships (PPPs) entities in the extraction and pipelines sector, which was the top sector from 2008-2012. Instead, the transportation sector has been the top sector for the last five years, accounting for 33 percent of committed finance since 2018.
Figure 5: Chinese Overseas Development Finance Commitments by Sector and Time Period

- Borrowers and sectors in lending from China and the World Bank: Most of China’s borrowers also borrow in significant quantities from the World Bank, although for different sectors. While Chinese loans are concentrated in infrastructure and extraction, World Bank loans have supported health, education and other core public administration sectors. Of China’s 100 borrowers, 72 borrow from the World Bank at greater or similar levels as China. Thus, for most borrowing countries, China appears to be a supplement for traditional development finance sources, albeit in different sectors.
Figure 6: Country Borrowing from World Bank and Chinese DFIs, 2008-2021
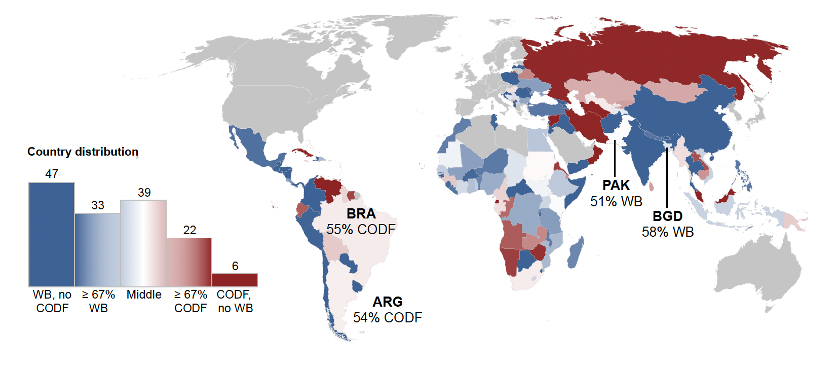
Figure 7: Sectoral Composition of Chinese and World Bank Development Lending, 2008-2021
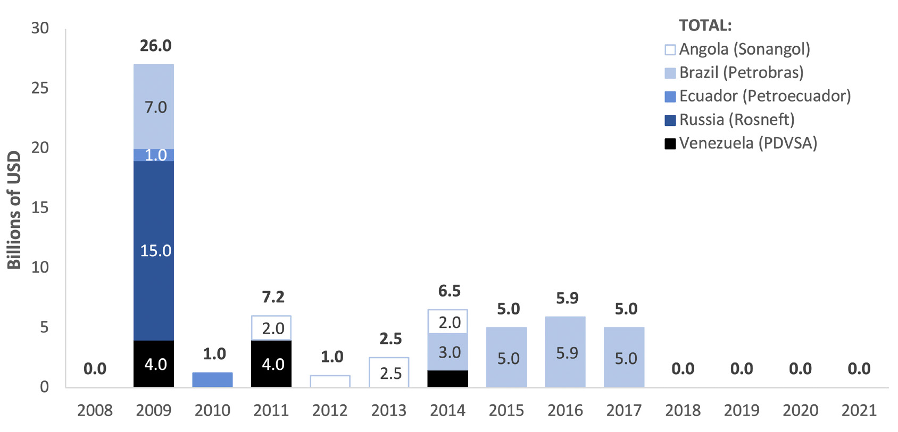
- The decline of lending to oil firms: General purpose lending to SOEs and PPPs in the extraction and pipelines sector like Angola (Sonangol), Brazil (Petrobras), Ecuador (Petroecuador), Russia (Rosneft) and Venezuela (PDVSA) accounted for $60 billion between 2009-2017. If these five firms were a country, they would have been the top national recipient of Chinese overseas development finance during this time period. However, CDB and CHEXIM have not made new general-purpose commitments to them since 2017.
Figure 8: Chinese General-purpose Development Lending to Hydrocarbons SOEs and PPP Entities
- Project geolocation: Of the $498 billion in Chinese overseas development finance, $278 billion supported 828 projects with physical locations. Of this, 736 projects (worth $267 billion, or 96 percent of the project-specific finance total) have been geolocated in the CODF Database within 25 kilometers, to support spatial analysis.
- Project overlap with environmentally sensitive territories declines: From 2018-2021, projects supported by Chinese development finance with geographic footprints have become much less likely to overlap with sensitive territories. In this period, 66 percent of finance for specific projects with geographic footprints had no overlaps with critical habitats, Indigenous peoples’ lands or national protected areas. This shift is a positive trend for conservation and Indigenous peoples’ rights.
CDB and CHEXIM may be unlikely to return to their earlier ambitious lending levels. While China’s current account surplus has rebounded (providing capital that can be mobilized abroad), its policy priorities have been directed inward in response to the COVID-19 pandemic and its attendant economic impacts. Concomitantly, big borrowers like Argentina and Pakistan have begun to propose ambitious new finance projects but have limited space for new borrowing amid a burgeoning global debt crisis.
Explore the Data Read the Policy Brief 阅读中文版政策简报