| The
BU-FCRAO Milky Way Galactic Ring Survey
II. Kinematics and Correlation
with the Optical, HI, and Infrared
M. Kolpak, R. Simon,
J.M. Jackson, D.P. Clemens, T.M. Bania, (Boston University), M.H. Heyer
(UMass)
M.P. Egan, and S.D.
Price (VSBC, Hanscom AFB) |
Abstract
We present a preliminary
analysis of the data from the first two square degrees of the Milky Way
Galactic Ring Survey (GRS), a 13CO and CS molecular line survey
of the Inner Galaxy.
The 13CO velocity
channel maps reveal an enormous amount of hitherto unresolved structure,
partly due to the higher angular resolution and better sampling of the
GRS compared to previous studies, but also due to the fact that the narrower
line widths of the more optically thin 13CO lines allow a better
separation of velocity components. The channel maps also demonstrate our
ability to distinguish different overlapping clouds along the line of sight
in velocity space. Our goal is to establish the kinematic distances to
these sources.
Overlays of our new 13CO
and CS data with an infrared image obtained with the MSX satellite at 8
micron wavelength reveal a striking correlation. Because we can associate
infrared sources with molecular clumps, we can estimate their distances
kinematically. We aim to find kinematic distances to a large number of
faint young stars and protostars in order to establish their luminosity
functions and spatial distributions throughout the 5 kpc Ring.
Using our new 13CO
data together with the Boston University-Arecibo Galactic HI survey, we
outline a method to solve the distance ambiguity. As an example, we present
results for an extended 13CO cloud at 25 km s-1 which
coincides remarkably well with extinction on the Digital Sky Survey optical
image. Its large extent and association with visual extinction as well
as HI self-absorption places this filament at the near kinematic distance.
Kinematics
The channel maps of 13CO
GRS emission shown in Fig.1 reveal the velocity structure for the first
two square degrees of the survey. We see large and small scale emission,
clumps, arcs, and filaments in essentially all channels. Even with the
relatively wide velocity interval of 10 km s-1 (corresponding
to 50 channels in our original spectra), we begin to discriminate a great
number of clouds at different radial velocities. The observed crowding
of emission around 60 km s-1 is expected since this is the tangent
point velocity in this direction.
|
Fig.1: Maps
of GRS 13CO 1-0 emission integrated
over 10 km s-1
wide velocity intervals. For each
subimage, the velocity interval
is given in the upper
right corner. The plot range
was chosen to start at
the average 3 sigma noise
level of the observations. |
We will use the high spectral
resolution of our data in conjunction with standard clump finding algorithms
to decompose the observed emission into clumps in configuration and
velocity space. We will thus be able to derive fairly accurate positions
of the clumps, their LSR velocities, and kinematic distances.
Here we focus on whether
the infrared sources can be correlated with molecular clumps observed in
13CO
and on how the kinematic distance ambiguity can be solved. To address these
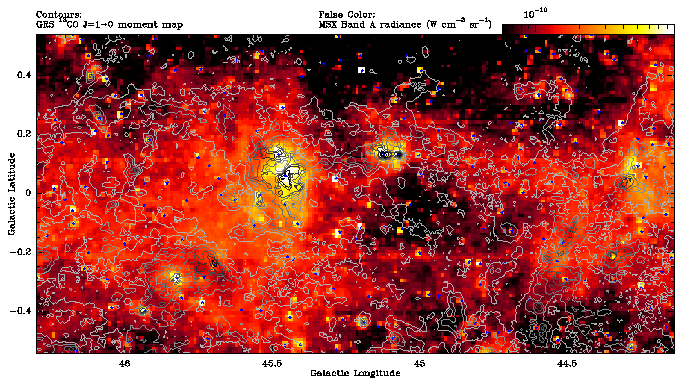
questions, we present an overlay of the GRS 13CO first
moment map with an infrared image obtained with the MSX satellite (Fig.2)
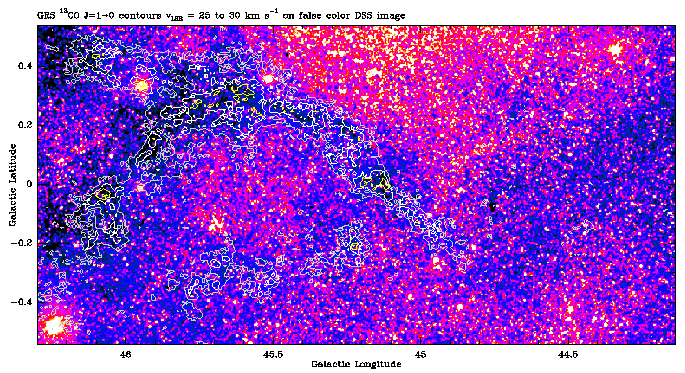
and associate the extended molecular filament in the 25-30 km s-1
velocity range with a feature seen in extinction in the optical and in
self-absorption in HI (Fig.3 and 4).
Correlation
with the Optical, HI, and Infrared
Fig.2: Overlay of contours
from the GRS 13CO 1-0 first moment map for emission between 0 and
80 km s-1 on a false color infrared image obtained with the MSX satellite
(Band A, 6.8-10.8 micron). The image has been background subtracted, which removes
both Zodiacal and very large scale Galactic emission. The angular resolution
of the infrared image is 36" compared with 46" of the GRS. Darker contours in
13CO correspond to intensity peaks. Positions from the IRAS point
source catalog are indicated by blue stars.
The 13CO data
show a remarkable correlation with the extended infrared emission. The
correspondence of molecular clumps and compact infrared sources on small
scales is even more striking. With the high resolution of both the GRS
molecular line and modern infrared data (MSX, ISO, 2MASS), we will for
the first time be able to associate a great number of embedded objects
with molecular cloud fragments at distinct velocities. Our goal is ultimately
to determine the distances to and luminosity function of the objects in
this new sample.
Fig.3: Overlay of GRS
13CO 1-0 contours integrated over the velocity range 25-30 km s-1
on a false color optical image of the appropriate region obtained from the Digital
Sky Survey (DSS) provided by Skyview. The contours start at the average 3 sigma
noise level of the map. Higher intensity contours are drawn in yellow to emphasize
the locations of peak 13CO emission.
The morphology of the
13CO emission is a remarkable match to that of the dark regions
of extinction seen in the optical image. Since peak 13CO emission,
and hence high column density, is observed towards regions of higher optical
extinction, we conclude that 13CO emission in this particular
velocity range and the optical extinction originate in the same material.
The visual extinction
on the DSS image is faint and might not be a useful indicator for nearby
small clouds. A more promising approach to determine whether a cloud is
near or far is to look for self-absorption (or the lack thereof) in a ubiquitous
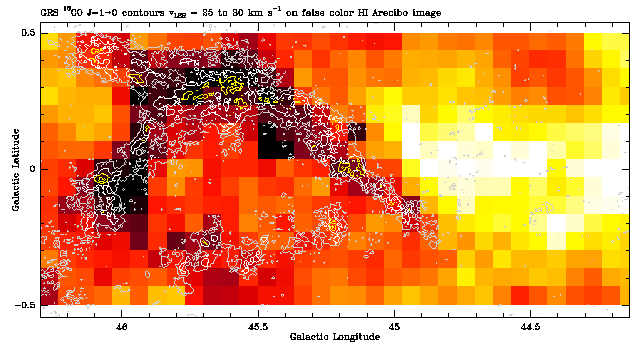
interstellar species: atomic hydrogen. Fig.4 shows a comparison of GRS
13CO
and HI from the BU-Arecibo Galactic HI survey.
Fig.4: Overlay of GRS
13CO 1-0 contours on a false color atomic hydrogen image obtained
for the BU-Arecibo Galactic HI survey (Bania 1999, private communication). The
velocity range for integration in both cases is 25-30 km s-1. The
same filament that is seen in 13CO emission and in extinction at
optical wavelengths is clearly seen in self-absorption in HI. Similar to the
case of optical extinction, peak 13CO intensities correspond to maxima
in HI self-absorption. Clearly cold HI is intimately associated with the molecular
gas. These two independent results unambiguously place the 13CO emitting
cloud at the near kinematic distance, i.e. 1.8 kpc from the Sun (using the Galactic
rotation curve derived by Clemens 1985, ApJ, 295, 422). Note that this filament
covers a large area on the sky, which is expected for a nearby cloud. Below,
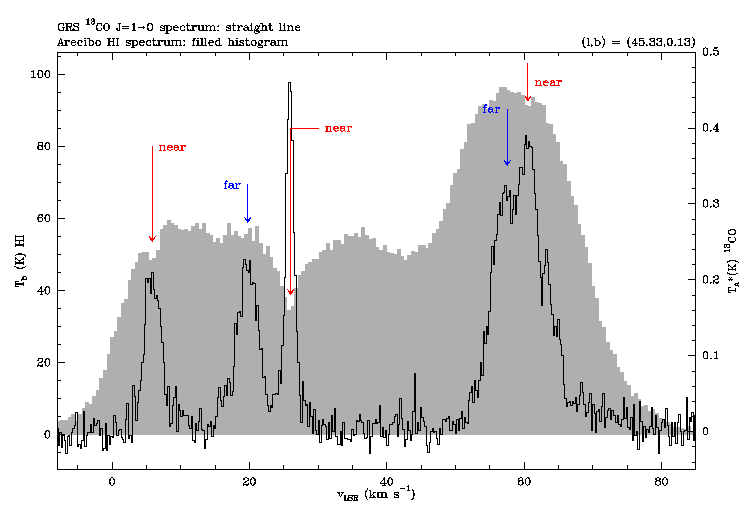
we outline our plans to solve the kinematic distance ambiguity. For this purpose,
sample spectra of 13CO 1-0 and HI observed towards one selected position
in the 25 km s-1 cloud are shown in Fig.5.
Solving the
Distance Ambiguity
The main objective of
the Galactic Ring Survey is to study the distribution of molecular clouds
and star forming regions in the Inner Milky Way at the highest angular
resolution and finest sampling ever. With this unique database, we will
be able to associate cloud cores with embedded infrared sources and clusters,
and to derive their luminosity function.
This last step requires,
however, that the distances to these objects be accurately known. The method
to determine distances to embedded infrared sources is a two step procedure.
First, the radial velocity of the Young Stellar Object's parental cloud
core must be found. Second, a kinematic distance must be assigned.
The positions and radial
velocities of clumps are provided by standard clump-finding algorithms
applied to the 13CO data. We then determine whether an infrared
source is present at the clump position and assign it the corresponding
velocity. The observed radial velocities of molecular clumps and cloud
fragments can be of course translated into kinematic distances if the Galactic
rotation curve is known (e.g. Clemens 1985, ApJ, 295, 422).
While this gives a unique
determination of the object's galactocentric radius, the line of sight
distance to the Sun is intrinsically double-valued. This is a consequence
of the geometry of the First Galactic Quadrant which gives the well known
near-far kinematic distance ambiguity.
We can solve the distance
ambiguity by using additional information supplied by modern 21cm HI observations.
The BU-Arecibo Galactic HI survey (BUAO) provides the highest angular resolution
(4') attainable by any single-dish radio telescopes at 21cm.
In the high resolution
BUAO spectra, HI can be seen in self-absorption against background 21cm
line emission if cold HI at the near kinematic distance absorbs 21cm radiation
from a warm cloud at the far kinematic distance. As opposed to absorption
observations toward a bright continuum source (e.g. HI and H2CO),
which require an HII region in the background, HI self-absorption is expected
to be observable on a much larger scale since atomic hydrogen is a ubiquitous
species in the interstellar medium and we expect to find a sufficient amount
of cold residual HI within the molecular clouds of our study.
A striking example of
an extended nearby cloud is shown in Fig.3 and 4. 13CO and HI
spectra toward a selected position in this filament Fig.5) show a deep
HI self-absorption dip at the radial velocity of 13CO emission
(25 km s-1). Besides this feature, many more velocity components
along the same line of sight are visible. These correspond to smaller clouds
and do not have equally obvious counterparts in the optical image. Only
the presence (or absence) of HI self-absorption allows us to unambiguously
assign the clouds to the near (or far) kinematic distance.
 Fig.5: A comparison
of GRS 13CO 1-0 and HI emission towards a
selected position in the 25
km s-1 filament. To enhance the signal
to noise and properly compare
the data sets, the \drco\ data have
been resampled to the HI resolution
and grid (4'). The presence
(or absence) of HI self-absorption
at the 13CO velocity places the
cloud at the near (or far)
kinematic distance.
 |
Based on the initial survey
results for the first two square degrees, we expect to identify several
thousand clouds and cloud cores with the GRS. A great number of these objects
will be associated with embedded infrared sources and clusters whose distances
can now be estimated.
The GRS thus not only constitutes
a unique database for determining the distribution of clouds, star forming regions,
and the structure of the 5 kpc Ring, it also provides the key to establish for
the first time the luminosity function of infrared sources and clusters throughout
the Inner Milky Way.
A
full size version of the poster can be obtained here (gzipped postscript file)
 |
The GRS is supported by
the NSF via grant AST-9800334 and AST-0098562 |


