|
BU-FCRAO Milky Way Galactic Ring Survey R. Simon, J.M. Jackson, T.M Bania, D.P. Clemens, and M.H. Heyer1 Institute for Astrophysical Research, Boston
University |
Abstract
We present a study of the structure of four molecular
clouds from the BU-FCRAO Milky Way Galactic Ring Survey (GRS), a high resolution
study of 13CO J=1-0 in the first Galactic quadrant using the
FCRAO 14m telescope. The clouds span a large range of star formation activity,
from W49, the most luminous star forming region in the Milky Way, to G045.46+0.05,
which has no obvious star formation activity. We use a three-dimensional
Gaussian decomposition to identify clumps and study their properties, including
sizes, masses, and line widths.
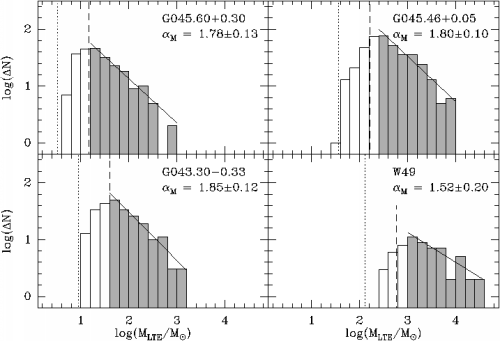
Every cloud has the same clump mass spectrum
independent of star formation activity. Relations of clump size with mass
and density differ from the conventional Larson relations and the line
width shows only a weak dependence with clump size.
While the clouds as a whole are in gravitational
virial equilibrium, most clumps are not gravitationally bound. Star forming
clouds have a much higher fraction of gravitationally bound clumps than
non star forming clouds. The unbound clumps are possibly confined by the
weight of the self-gravitating complex. The pressures needed to bind these
clumps are largest for the star forming clouds.
Introduction
When observed at increasingly higher linear resolution,
molecular clouds typically reveal a rich structure, often self-similar
or filamentary, along with a high degree of clumpiness. The observed properties
of the clouds and the clump ensembles yield important information on the
effects of turbulence and self-gravity, which are believed to generate
cloud substructure, and the process of star formation itself. Since the
GRS covers large areas of the sky on a Nyquist-sampled grid, with high
angular and spectral resolution, it constitutes a unique data base for
the investigation of molecular cloud structure within the first Galactic
quadrant.
To evaluate the internal structure of Giant Molecular
Clouds in the Inner Galaxy, we have analyzed four subfields within the ongoing
BU-FCRAO Galactic Ring Survey. The selected clouds (Fig.
1) cover a wide range of star formation activity. Coordinates and distances
are summarized in Table 1.

Fig. 1: Color scale representation of zeroth
moment maps of the GRS 13CO intensity integrated over the specified
velocity range relevant for emission from the individual cloud complexes. The
top panels show two clouds without star formation and the bottom panels display
the star forming clouds.
The plot ranges are:
Top: 13CO integrated intensity
from 1.3 to 7.5 K km/s (left panel) and 2.6 to 68.7 K km/s (right panel).
Bottom: 13CO integrated
intensity from 1.1 to 10.3 K km/s (left panel) and 3.2 to 158.5 K km/s
(right panel).
The beam size is indicated in the lower left corner of each panel.
The linear size scales were determined assuming the distances given in
Table. 1.
Table 1: Molecular clouds selected for this study.
| Clouda | Longitude | Latitude | vLSR(km/s) | Distance (kpc) |
| G45.0+0.3 | 45.60 | +0.30 | 25.0 | 1.8b |
| G43.3-0.3 | 43.30 | -0.33 | 40.0 | 3.0b |
| G45.5+0.1 | 45.46 | +0.05 | 60.0 | 6.5b |
| W49 | 43.17 | +0.00 | 11.2 | 11.4c |
a) Position of a prominent 13CO
b) Distances determined kinematically (see Jackson et al., 25.03).
c) Distance from Gwinn, Moran, & Reid (1992, ApJ, 393, 149).}
We model the three-dimensional (two spatial and one velocity) data as Gaussian-shaped clumps using the algorithm developed by Stutzki and Güsten (1990, ApJ, 356, 513).
Clump-Mass Spectra
The clump masses are determined using the fitted 13CO clump brightness temperatures and line widths in an optically thin LTE approximation at an excitation temperature of 10 K. In this case, the mass of a clump depends on the integrated intensity of the 13CO line, the area covered by the clump, the excitation temperature T (which together with the integrated line intensity determines the total molecular column density of 13CO), the relative abundance of 13CO to H2 column density, and on the distance to the cloud. We applied conversion factors of R(12CO/13CO)=45 adopted from Langer & Penzias (1990, ApJ, 357, L477) and X(12CO/13CO) = 8 x 10⁻⁵ (Blake et al. 1987, ApJ, 315, 621), as well as a correction to the hydrogen mass of a factor of 1.36 to account for Helium and other heavy elements (Allen 1973, Astrophysical quantities). The clump mass in Solar masses is given by:
M = 3.05 x 10⁻²⁵ N(13CO) Rx Ry D2
where Rx and Ry are the sizes of the principal half-axes of the clump
in arcseconds and D is the distance to the cloud in pc. The resulting clump-mass
spectra dN/dM is proportional to M-alpha are shown in
Fig.
2.

Fig. 2: Clump-mass spectra of the four GRS clouds. Star forming clouds are on the right. Only masses well above the completeness limit (dashed line, bins indicated by the filled histogram columns), were used in a fit to derive aM. A dotted vertical line is drawn at the value of the minimum clump mass we allowed the algorithm to find. The errors have been evaluated by taking into account the Delta N1/2 statistical error for each mass bin.
We do not find any significant differences
in the clump-mass spectra of the star forming and non star forming clouds.
Scaling Relations
Once the clumps are identified, general trends in their properties (e.g. mass, size, density, and line width) are used to characterize cloud structure. Although applying different methods, many studies arrive at consistent results for scaling relations with the sizes of structures as first pointed out by Larson (1981, MNRAS, 194, 809). The corresponding relations for the four GRS clouds are plotted in Fig. 3 and the results (including the dispersion) are compared to the relations for virial equilibrium in Table 2.

Fig. 3: Relation of clump size with line width and mass of the clumps for the GRS clouds. Clumps in star forming clouds are represented by green and blue symbols. Straight lines represent least squares fits to the slopes. The power law indices (including the dispersion) are included in Table 2. Note that, due to redundancy, results for the size-density relation are not shown in the plot. The different ranges in size are partly due to the different distances to the clouds.
Table. 2: Summary of power law relations for the clumps.
| Size- | Size- | Size- | Mass | |
| Cloud | Density | Line width | Mass | spectrum |
| G45.0+0.3 | 0.86(0.33) | 0.15(0.33) | 2.21(0.33) | 1.78(0.13) |
| G43.3-0.3 | 0.73(0.35) | 0.30(0.35) | 2.27(0.35) | 1.85(0.12) |
| G45.5+0.1 | 0.75(0.32) | 0.29(0.32) | 2.25(0.32) | 1.84(0.10) |
| W49 | 0.84(1.01) | 0.16(1.01) | 2.15(1.01) | 1.56(0.20) |
| Weighted Mean | 0.78(0.19) | 0.24(0.19) | 2.24(0.19) | 1.80(0.10) |
|
Virial Equilibrium
|
1.0 | 0.5 | 2.0 |
Our relations of clump size with density, line width, and mass systematically differ from the conventional scaling relations for virial equilibrium. The size-line width relation is flatter and the size mass relation steeper, resulting in a weak dependence of the surface density with mass.
Equilibrium
The equilibrium state of the clumps is deduced from the comparison
of virial and LTE mass of the clumps shown in (Fig.
4). While the cloud complexes as a whole are gravitationally bound,
most of the clumps are unbound. This explains the above shown deviation
from the standard Larson relations which are only valid for objects in
virial equilibrium. It turns out that the pressures needed to confine the
unbound objects are possibly provided by the overlying weight of the bound
complex and are largest for the star forming clouds. Under this assumption,
most of the overpressured clumps will not be transient. The magnitude of
the binding pressures points towards a higher external pressure in the
Inner Galaxy compared to the Outer Galaxy.

Fig. 4: The ratio of virial to LTE mass
for the clumps in the GRS clouds.
Star forming clouds
are on the right. The dotted line represents gravitational virial
equilibrium: Clumps below this line are gravitationally bound.
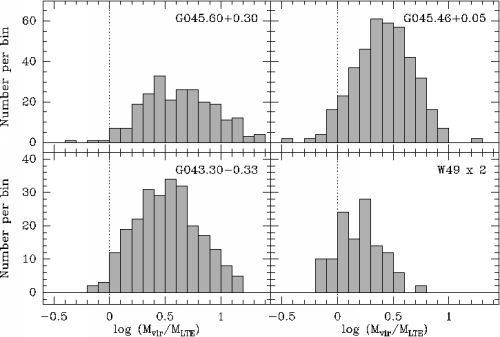
The histograms shown in Fig. 5 are used to evaluate the fraction of gravitationally bound clumps in the clouds.

Fig. 5: Histograms of the ratio of virial to LTE mass for the clumps. Star forming clouds are on the right. The dotted line corresponds to Mvir = MLTE: Clumps to the left of this line are gravitationally bound.
In order to test whether our results are influenced by spatial resolution,
we smoothed the nearest cloud G45.6+0.3 to a five times larger distance.
Results of our standard clump decomposition applied to this data
set (see Fig. 6 below) reveal the same qualitative
properties of clumps at high and low angular resolution.

Fig. 6: Ratio of virial to LTE mass for the non star forming cloud G45.6+0.3 with the full resolution (circles) and smoothed to a five times larger distance (triangles).
We conclude that the star forming clouds have a higher fraction of gravitationally bound clumps than the non star forming clouds.
Conclusions
 |
The GRS is supported by the NSF via grant AST-9800334 and AST-0098562 |