|
Abstract
We search the first six square degrees of the
Milky Way Galactic Ring Survey (GRS) for correlations between molecular
and infrared emission. Extended infrared emission correlates well
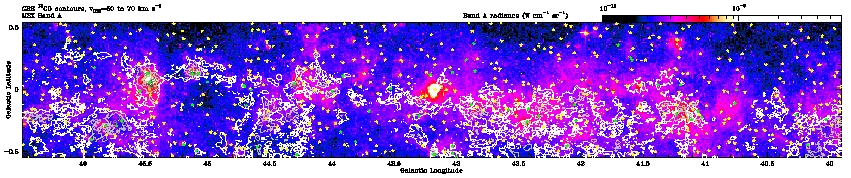
with extended 13CO emission (Fig. 1)
Many compact infrared sources identified by MSX and IRAS are also often
coincident with 13CO clumps. These sources are probably
embedded young stars and protostars. By associating infrared point
sources with 13CO emission, we estimate their kinematic distances.
We resolve the near/far distance ambiguity using H I self-absorption data
from the BUAO survey. Using the estimated distances, we calculate total
far infrared luminosities. Once the distances to enough faint young
stars and protostars have been estimated, we will determine their
luminosity functions and spatial distributions throughout the Inner Galaxy.
Fig. 1: Overlay of contours from 6 square degrees of the GRS 13CO channel map for emission between 50 and 70 km/s on a false color infrared image obtained with the MSX satellite (Band A, 6.8-10.8 micron). The image has been background subtracted which removes both Zodiacal and very large scale Galactic emission. The contours plotted are for 5, 10, 17 and 25 K km/s. The angular resolution of the infrared image is 18" compared with the 46" resolution of the GRS. Darker contours in 13CO correspond to intensity peaks. IRAS point sources are marked with yellow stars, and IRAS point sources associated with 13CO clumps are marked with green stars.
Investigation
How well is the 13CO emission correlated with infrared emission? How many IRAS point sources are obviously associated with 13CO clumps? Can we use molecular kinematics to find distances to infrared sources? Is the association sample large enough to measure its luminosity function and spatial distribution?
Analysis
We superpose contours of 13CO emission on MSX images (Egan
et al., 1998) to look for correlation between molecular and infrared emission
(Fig. 1). We find roughly 500 IRAS point
sources coincident with 13CO features, and 118 of these are
clearly associated with bright, isolated 13CO clumps.
For these unambiguous cases, we assign LSR velocities to the infrared point
sources using the 13CO velocities. After resolving the
near/far distance ambiguity using the HI data, we calculate distances to
the IRAS point sources assuming the rotation curve of Clemens et al. (1988).
These distances allow us to estimate the total far infrared luminosity
from the IRAS 60 and 100 micron fluxes (Fig. 2).
To explore the spatial distribution of these 118 13CO-IRAS point
source associations, we mark their positions on a face-on map of the Galaxy,
together with the distribution of 13CO clumps (Fig.
3). Galactic distribution of 13CO LTE mass (Fig.
3).

Fig. 2: Luminosity histogram for IRAS point sources associated with bright isolated 13CO clumps. The luminosities, ln(L/Lsun), range from 1.6 to 6.68. with an average of 3.7. The average distance is 6.558 kpc.

Fig. 3: Face-on Galactic distribution
of molecular gas and IR sources. The shading is proportional to 13CO
clump LTE mass. The red stars represent IRAS point sources, and their
sizes are proportional to their luminosities.
(Note
that both the molecular gas and the infrared point sources show clear concentrations
and gaps. The 13CO shows clear concentrations and gaps, and
the distribution of infrared sources is different.) The face-on
Galactic distribution of molecular gas and IR sources for the region covered
by the GRS to date. The axes represent distances in kpc; the sun and the
Galactic Center are marked. The greyscale shading of each pixel is
proportional to the total mass of clumps within that pixel. The red
stars mark the positions of IRAS point sources and their sizes are proportional
to log(L). The horizontal line is an artifact produced by the assignment
of all forbidden velocity clouds to the tangent point.
Discussion
Figure 1 reveals an excellent correlation between 13CO
emission and many extended infrared features. The correlation is
particularly striking in the region of G45.5+0.1, a star-forming molecular
cloud at a distance of roughly 6 kpc. The infrared features that
appear not to have molecular counterparts are associated with 13CO
emission at different velocities, hence at different distances, than the
contour map shown in figure 1. For example, the extremely bright
infrared feature at l = 43.2 that appears not to have a 13CO
counterpart is W49. W49 is at a distance of 11.6 kpc,
and has an LSR velocity of 10 km/s. We find total far infrared luminosities
of IRAS point sources as faint as a few hundred solar luminosities and
as bright as a few million solar luminosities. These luminosities
correspond to spectral types A1 to O4 (Panagia, 1973).
Future Work
We find distances and luminosities for the most obvious 118 correlations
between IRAS point sources and 13CO clumps. Most of the
remaining IRAS point sources are coincident with morphologically complex
13CO
emission or multiple 13CO clumps along the line of sight at
different velocities. We plan to compare GRS data with high resolution
infrared data (MSX, 2MASS, ISO) to associate these point sources with some
of the more complex 13CO features. When the GRS is finished,
we expect roughly 700 simple and a few thousand complex IRAS point source
correlations.
Conclusions
Overall, there is a remarkable correlation between extended emission in 13CO and the infrared. We find distances and luminosities for nearly 25% of IRAS point sources coincident with 13CO emission in the GRS region. When the GRS is finished, we expect roughly 700 simple IRAS point source correlations with which we can begin to determine the luminosity function for infrared sources in the Inner Galaxy. The large scale spatial distribution of these infrared point sources is significantly different from Galactic structures seen in 13CO.
REFERENCES:
Clemens, D.P., et al., 1988, ApJ, 327, 139
Egan, M.P., et al., 1998, ApJ, 494, L199
Panagia, Nino, 1973, AJ, 78, 929
A full size version of the poster can be obtained here (gzipped postscript file)
 |
The GRS is supported by the NSF via grant AST-9800334 and AST-0098562 |