
|
J.M. Jackson, T.M. Bania, M. Kolpak, R. Simon, D.P. Clemens, and M.H. Heyer1 Institute for Astrophysical Research, Boston
University |
Abstract
We have analyzed the first ten square degrees of the Boston University-Five College Radio Astronomy Observatory Galactic Ring Survey (GRS), a new, fully-sampled survey of 13CO emission over a large portion of the inner Galaxy. We compare the GRS 13CO maps to 21 cm H I maps from the Boston University-Arecibo Observatory Galactic HI Survey. Toward many molecular clouds, we find a remarkable association between 13CO emission and HI self-absorption, both in velocity and morphology. In particular, G45.6+0.3, a large filamentary cloud, shows deep HI self-absorption throughout the 13CO emitting region. This cloud is also associated with pronounced optical extinction and thus lies at the near kinematic distance. Another cloud, G43.3-0.3, also shows a pronounced correlation between 13CO emission and 21 cm H I self-absorption.
Position-velocity diagrams also show a number of additional molecular clouds that correspond with HI self-absorption.
Photodissociation theory suggests that the skins
of typical molecular clouds exposed to normal Galactic UV radiation fields
will exhibit H I self-absorption against strong H I backgrounds. Because
H I emission is ubiquitous throughout the Galaxy, with sufficient angular
resolution, the cold H I can be used to determine whether the molecular
cloud lies at the near or far kinematic distance. Clouds at the near
distance will show H I self-absorption, whereas clouds at the far distance
will show H I in emission. This technique can resolve the kinematic distance
ambiguity by cleanly separating near clouds from far clouds.
Introduction
We compare the GRS 13CO molecular data
and 21 cm H I data taken from the Boston University-Arecibo Observatory
(BUAO) Galactic H I
Survey. The BUAO Survey parameters are:
Table. 1: BUAO Galactic HI Survey
| Galactic Longitude | 30.5 to 60.5 degrees |
| Galactic Latitude | -0.5 to 0.5 degrees |
| Angular resolution | 4' HPBW |
| Angular sampling | 2' or 4' intervals |
| LSR velocity range | -264.0 to +264.0 km/s |
| Velocity resolution | 0.52km/s |
| Sensitivity | 0.5 K |
In the course of this comparison, we found that a number of
clouds show a clear correspondence between 13CO emission and
H I self-absorption, both in morphology and in velocity. Although H I self-absorption
toward molecular clouds has been known for some time, this is the first
clear correspondence between H I self-absorption and CO emission in both
2-dimensional morphology and in velocity. This correspondence suggests
that these molecular clouds contain significant amounts of cold atomic
hydrogen.
Breaking the Near-Far Kinematic Distance Ambiguity
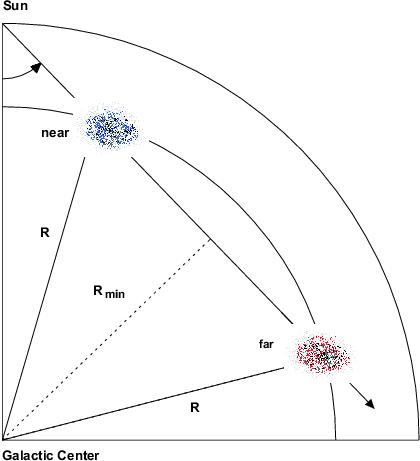
As a special consequence of the geometry of the inner Galaxy, any particular value of radial velocity corresponds to two distances along the line of sight, called the ``near'' and ``far'' distances. Thus, kinematic information alone cannot establish a reliable distance estimate, due to this so-called ``distance ambiguity.''
The likelihood of detecting H I self-absorption,
however, favors the geometry in which a molecular cloud lies at the near
kinematic distance. Since H I is ubiquitous throughout the Galaxy, warm
H I emits at essentially every velocity. For clouds at the near kinematic
distance, there is an ample amount of H I at the far distance against which
a cold molecular foreground cloud can be seen in silhouette. If the
same cloud were placed at the far distance, there would be very little
background H I, and the self-absorption feature would be absent. Even if
a ``far'' molecular cloud were to have HI self-absorption, it would not
be observed since its characteristic spectral signature would be filled
in by emission from H I at the foreground near position. The geometry is
illustrated in a face-on sketch of the Inner Galaxy in Fig.
1.
|
|
|
Fig. 1: Face-on sketch of the geometry of H
I self-absorption in the First Quadrant of the Milky Way. Statistically, only
H I associated with molecular clouds located at the near kinematic distance
will show the characteristic spectral signature of H I self-absorption. This
is seen schematically in the two plots which show gray scale H I spectra with
13CO spectra superimposed as either red or blue line profiles.
G45.6+0.3 : A Case Study
The cloud with the deepest self-absorption line, G45.6+0.3, shows
pronounced visual extinction, and is therefore unequivocally located at
the near kinematic distance. A second cloud with deep H I self absorption,
G43.3-0.3, probably also lies at the near kinematic distance. We suggest
that, since the
geometry of self-absorption favors clouds located at the near kinematic
distance, then the presence or absence of self-absorption may prove to
be a powerful technique to resolve the near-far distance ambiguity.
Fig. 2: Overlay of GRS 13CO J=1-0
contours towards G45.6+0.3 integrated over the velocity range 25-30 km/s on
a false color image of the appropriate region from the BUAO H I Survey. Black
indicates H I self-absorption. The 13CO contours start at the 3sigma
level of the map. Higher intensity contours are drawn in yellow to emphasize
the locations of peak 13CO emission.
Fig. 3: Overlay of the GRS 13CO J=1-0
contours from Fig. 2 towards G45.6+0.3 on a false color optical image of the
appropriate region from the POSS plate (Digital Sky Survey, DSS).
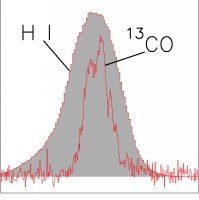
Fig. 4: A comparison of GRS 13CO
J=1-0 (black line) and H I (solid gray) emission towards a selected position
in G45.6+0.3. To enhance the signal to noise and properly compare the
data sets, the 13CO data have been resampled to the H I resolution and grid
4'. The presence (or absence) of H I self-absorption at the 13CO velocity places
the cloud at the near (or far) kinematic distance.
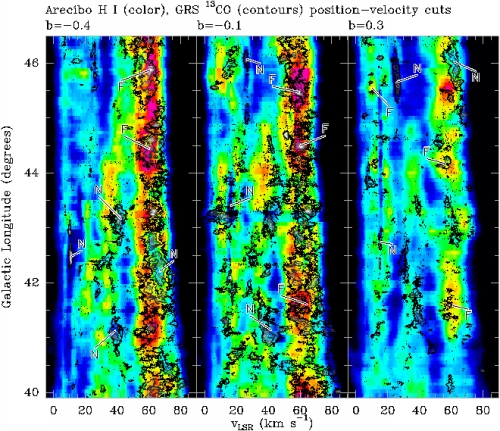
Fig. 5: Shown is a comparison between
GRS 13CO and BUAO H I emission in longitude-LSR velocity
space. Color indicates the H I brightness temperature distribution
at three galactic latitudes for the longitude range 40 < l < 46.3.
Red corresponds to the strongest H I emission, blue to the weakest. The
GRS 13CO emission distribution is drawn as black to white contours
as intensities increase. It is clear that 13CO features correlate
both with H I peaks and H I valleys. Analysis of the H I valley spectra
shows that many have the characteristic signature of H I self-absorption,
indicating that the CO cloud is located at the near kinematic distance.
CO clouds associated with H I peaks are located at the far kinematic distance
(see Figs. 1 through 4).
Based on H I self-absorption,
we indicate here with the symbols ``N'' and ``F'' whether a given 13CO
emission clump is located at the Near or Far kinematic distance.
Conclusions
In comparing the 13CO Galactic Ring Survey with the BUAO H I survey, we have found that many molecular clouds exhibit both 13CO emission and H I self-absorption. We conclude the following:
A
full size version of the poster can be obtained here (gzipped postscript file)
 |
The GRS is supported by the NSF via grant AST-9800334 and AST-0098562 | The BUAO H I Survey was supported by NSF grant AST-8511844 |