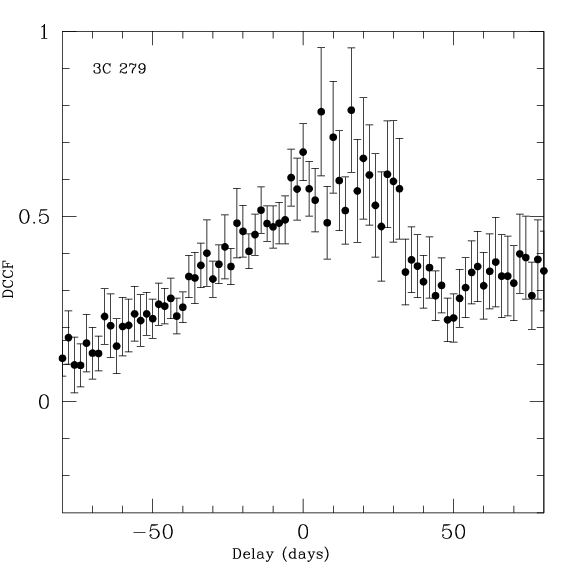

We currently monitor 3C 279 three times per week with RXTE, except for an 8-week period when it is too close to the sun in the sky. Svetlana has made a movie that you can view showing the ejection and motion of superluminal knots and the X-ray, radio, and optical light curves for 3C 279. Below is a plot of the mulitfrequency light curves, complete up to January 2007. The 2nd plot is the discrete cross-correlation function (as defined by Edelson and Krolik, 1988 Astrophysical Journal, 333, 646) between the optical (visible) and X-ray variations in brightness. The correlation between the optical (visible) and X-ray is excellent, with a time lag of several days (i.e., the X-ray variations tend to occur after those seen at optical frequencies). The radio jet is quite complex, so that the birth of a new bright knot (noted by upward arrows in the plot) often cannot be distinguished on the radio light curve; for this reason (as well as the opacity of the jet near the core at 37 GHz), there is not a good correlation between the X-ray and radio light curves except for major outbursts, for which the radio is delayed by several months. The ejections of superluminal components (bright features in the jet) in 3C 279 seen in sequences of VLBA images (or, if your connection is fast, view the higher-resolution sequence of images) tend to occur near the time of X-ray flares. We are working on quantifying this. The vertical arrows on the light-curve plot show times of ejection of apparent superluminal bright spots, with the horizontal bars showing the uncertainty in time of ejection (defined as when the new feature coincided with the core).


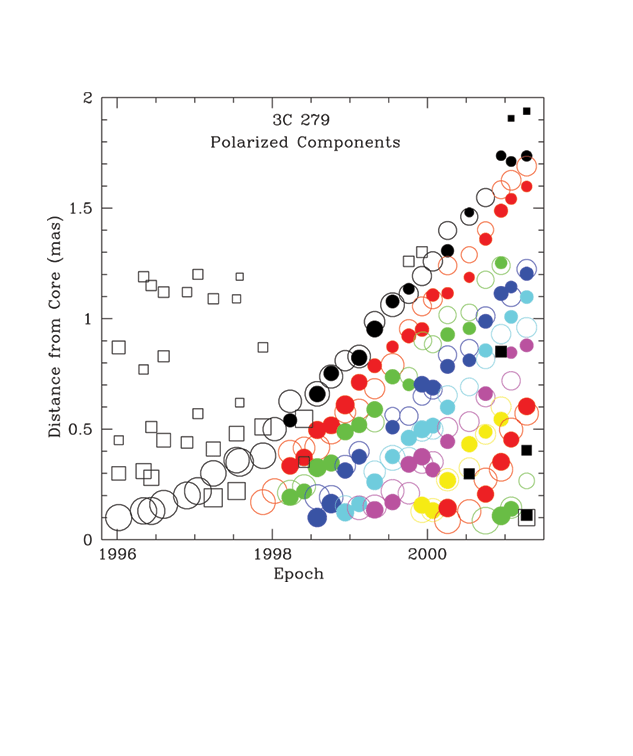
The plot below, taken from our sequences of VLBA images page, shows the positions of bright spots (referred to as "components," "knots", or, mostly elegantly, "blobs") as they move downstream from the core of the jet. The slope of each trajectory corresponds to the apparent speed. The hollow squares and circles give the positions as seen on the total intensity images, while the filled circles give the positions on the linearly polarized intensity images. The latter measure how well ordered the magnetic field is in the jet, so the brightest spot in polarization corresponds to a region of high brightness and fairly well-ordered magnetic field.

The main point of interest here is that the apparent speed of knots in the jet suddenly increased from about 5 times the speed of light before 1998 to 13 times afterward. Later, in 2001, the speed increased to about 25 times the speed of light! The plot below shows this in the bottom panel. The jet (the part near the core) changed direction during this time, as shown in the middle panel, where -135 degrees is in the southwest direction, -180 degrees is due south, and -90 degrees is due west. The change in apparent speed - as well as a downward trend in the X-ray brightness and decrease in level of variability - corresponded to a swing of the jet to the south. We're continuing to follow this object in order to determine whether this relationship is significant and to probe the jet of 3C 279 further.
