Efficiency: The Next Frontier of Hotel Revenue Management

By Minwoo Lee, Ph.D., Assistant Professor, University of Houston – Conrad N. Hilton College of Hotel and Restaurant Management; Jaewook Kim, Ph.D., Assistant Professor University of Houston – Conrad N. Hilton College of Hotel and Restaurant Management and; Agnes L. DeFranco, Ed.D., Professor & Conrad N. Hilton Distinguished Chair, University of Houston – Conrad N. Hilton College of Hotel and Restaurant Management
What to Sell and How to Sell Matter: Focusing on Business Performance and Efficiency
Hotel revenue management has been a hot topic for both academic researchers and hotel industry practitioners. Revenue management (RM) is “a set of tools and actions used by managers to optimize the net revenues and the gross operating profit by offering the right product to the right customers via the right distribution channel at the right time at the right price with the right communication” (Kimes, 1989; Ivanov, Chiappa, & Heyes, 2021). Due to the unique nature of hotel management (e.g., capacity-constrained business, perishability, intangibility, high fixed costs, low variable costs, etc.), RM is critical for hotel firms to maximize their profits through revenue optimization and business efficiency. Although revenue optimization is a key RM strategy for hotel firms, the traditional room-centric RM approach may not be sufficient to achieve this goal (Kim, Kim, & Lee, In press). In addition, the COVID-19 pandemic has changed the hospitality industry tremendously and increased market uncertainty, leading to serious challenges and also new opportunities for revenue managers (Bhogaraju, 2021). Therefore, hotel owners, operators, and management alike all need to increase operational efficiency and offer profitable services to survive and be successful in the current competitive and uncertain hospitality market (Research and Markets, 2020).
Prior hotel RM research has focused on introducing pricing and non-pricing RM practices and examining their impacts on consumer behaviors and financial performances in the hotel industry (Ivanov et al., 2021; Lee, Jeong, & Shea, 2021). Recently, various RM models and approaches have been implemented in the hotel industry because total sales and revenues generated from the sales of goods, products, and merchandise are key performance indicators for a hotel firm’s success. For instance, sales mix (i.e., the relative proportion of hotel products or services sold) and how it affects profitability becomes a critical business success factor and is considered as a proxy of overall business operations’ productivity and efficiency (Quain, 1992, Higuerey et al., 2020). Productivity and efficiency levels are significantly influenced by the hotel’s sales mix and thus efficient operation protocols and sales mix optimization are crucial for hotel firms to maximize profits. Moreover, due to service products’ perishability and intangibility, sales mix optimization for RM plays a critical role in enhancing business efficiency.
However, a traditional room-centric RM approach is not sufficient for the contemporary hotel firms to achieve the financial goals based on customer-driven market trends, demand-driven pricing strategies, and sales mix design (Zheng & Forgacs, 2017). There are also essential factors and components such as market segmentation, business characteristics, hotel service level, the property’s spatial resources (e.g., rooms, common spaces, F&B outlets, spas, etc.), and comparative performance evaluation to develop hotel’s optimal sales mix and enhance business efficiency (Kim et al., in press). Therefore, this article tries to answer the practical question: how can hotel firms optimize revenue and determine business efficiency based on productivity and profitability measures? The answer: by analyzing a unique dataset containing 40 hotels located in Houston and New York City (NYC) through Data Envelopment Analysis (DEA) in order to identify opportunities for each hotel to increase its efficiency score and to be on the efficiency frontier.
Hospitality Data Analytics for RM Strategy: Comparative Operation Efficiency Analysis
The DEA model computes the performance or efficiency index for a decision-making unit (DMU) as a ratio of multiple outputs to multiple inputs, subject to the constraint that all the efficiency indexes for other DMUs are equal to or smaller than one (Callen, 1991). DEA can be viewed as a multiple-criteria evaluation methodology where DMUs are alternatives, and DEA inputs and outputs are two sets of performance criteria where one set (inputs) is to be minimized and the other (outputs) is to be maximized (Charnes et al., 1978). A DMU is efficient if its efficiency index is one and inefficient if less than one.
The first key issue in any DEA application is the selection of inputs and outputs. A DEA model deals with multiple performance measures (inputs and outputs) in a single integrated model (Thanassoulis, 2001). The outputs should reflect the business goals, and the inputs should be the required resources for achieving those goals. The second key issue is the composition of the competitive set. Efficiency measure from the DEA model is comparative. Since efficiency should be understood based on industry, market, and firm characteristics, direct competitors in a similar market segment should be selected for the competitive set. Then, each hotel’s efficiency score will be comparatively measured from 0 to 1. DEA determines where the best practice is when the data is plotted to establish the efficient frontier consisting of comparatively the best performing DMUs (Min et al., 2008).
To measure the comparative operation efficiency of 40 hotels in two metropolitan cities (i.e., 20 hotels in Houston and 20 hotels in NYC) relative to their key competitors, DEA was performed (Callen, 1991). The DEA method regards each hotel property as a DMU. A DMU is best efficient in its competitive set if its efficiency score is 1.0, and inefficient if less than 1.0. The 40 hotels are grouped as follows: for Houston, there are seven economy and mid-scale hotels (STR class code 5-6) in Group 3, seven upper-middle and upscale hotels (STR class code 3-4) in Group 2, and six fully equipped upper-upscale and luxury hotels (STR class code 1-2) in Group 1. For NYC, there are three economy and mid-scale hotels (STR class code 5-6) in Group 3, nine upper-middle and upscale hotels (STR class code 3-4) in Group 2, and eight fully equipped upper-upscale and luxury hotels (STR class code 1-2) in Group 1. The DEA was then carried out on these 40 properties for efficiency measures and detailed comparisons.
Table 1. Descriptive statistics
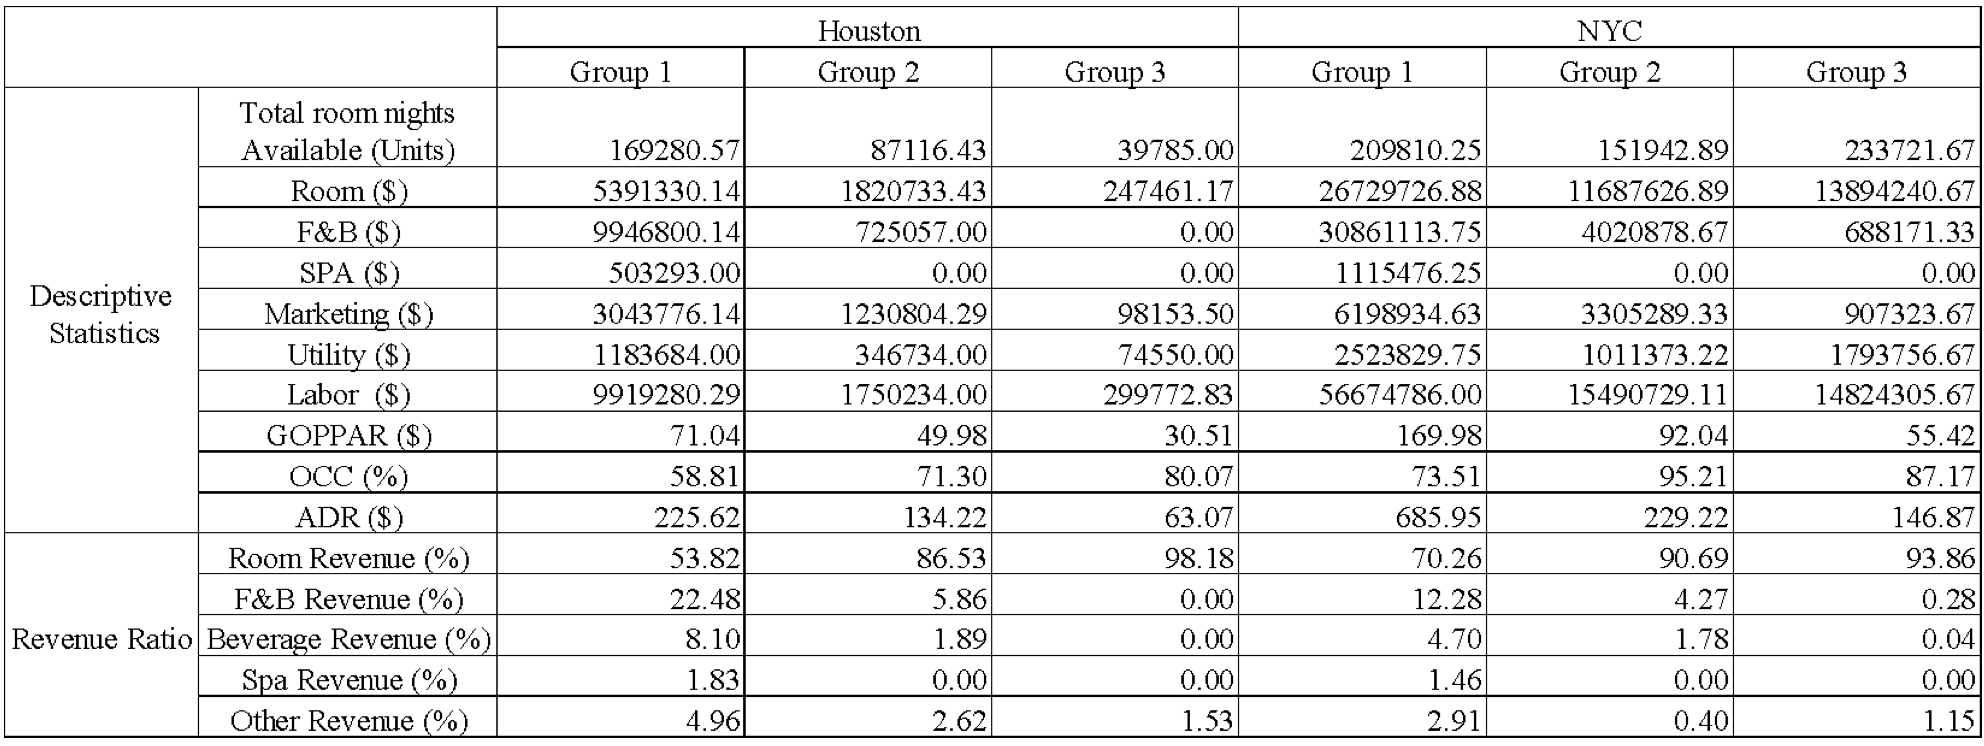
As seen in Table 1, seven inputs (total room nights, rooms revenue, food and beverage revenue, spa revenue, marketing expense, utility expense, and labor cost) and three outputs (gross operating profit per available room – GOPPAR, occupancy percentage – OCC%, and average daily rate – ADR) were used in the analysis. Group 3 relies relatively heavily on rooms revenue (93.86% of total revenue in NYC and 98.18% in Houston) when compared to other groups (Group 2 – 86.53% in Houston and 90.69% in NYC; Group 1 – 53.82% in Houston and 70.26% in NYC). This finding means that luxury and upper-upscale hotels should fulfill different needs and wants of their guests, and thus revenue source diversification (e.g., spa, food, beverage, others, marketing, etc.) is a critical strategy that affects competitive advantages.
The next step is to examine the importance of operational efficiencies of these 40 properties. Table 2 shares the results of the 40 hotel properties across two cities when each of their relative operational efficiency scores is calculated based on the best efficient frontier as determined by seven inputs and three outputs mentioned above.
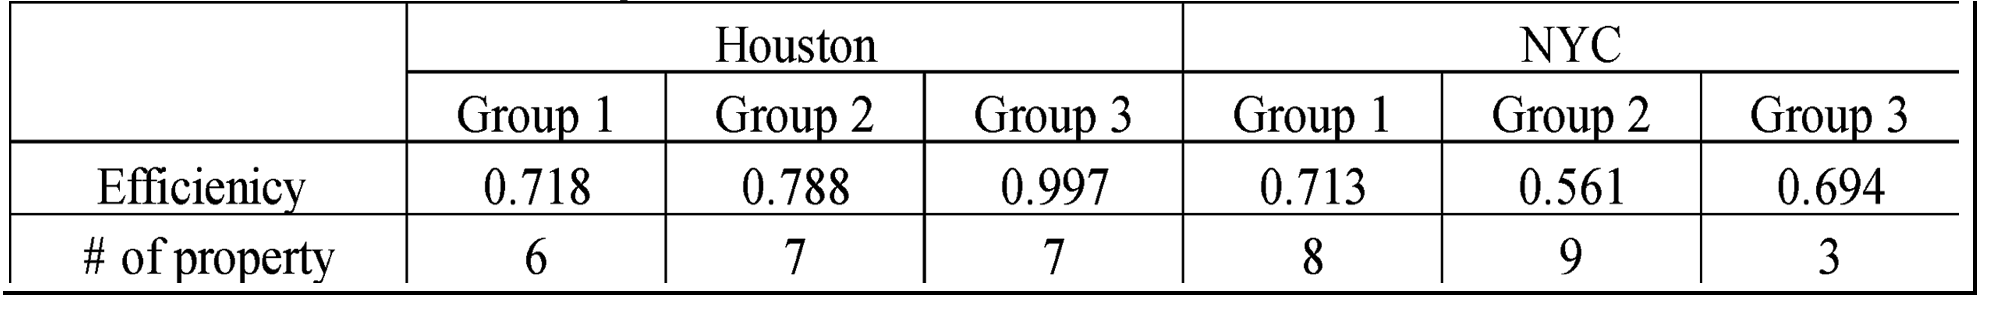
Finally, Table 3 indicates the summary of each group in the two cities for comparison purposes. Efficiency index was used for in-group comparison in each city as well as inter-group comparison between two cities. Group 3 indicates the highest operational efficiency (0.997 in Houston and 0.694 in NYC). There is a limited number of Group 3 hotels in NYC, and one of the three hotels shows an extremely poor efficiency index (0.083 as seen in Table 2). The other two were found to have a completely efficient frontier in the market. In Houston, Group 1 shows the lowest efficiency index meaning that fully operating multiple revenue sources needs parsimonious operational strategies to secure efficiency. On the other hand, Group 1 in NYC is positioned as the most efficient group. This interesting finding means that luxury and upper-upscale hotels in NYC are operating their business efficiently, and this is evident in the much higher average ADR than other groups.
The mean values of the efficiency index for Group 1 hotel properties in two cities are similar (0.718 in Houston and 0.713 in NYC), which proposes that collectively, if upper-upscale and luxury hotel properties reduce their consumption of inputs by around 28%, they can reach the frontier and thus achieve efficient operation performance. The mean values of the efficiency index for Group 2 hotel properties in two cities are quite different from each other (0.788 in Houston and 0.560 in NYC). Due to the market characteristics, and more travelers are staying in NYC than in Houston, their needs and wants are also different. Such guest demographics could be a good source of finding efficiency strategies among competitive sets.
Lastly, the mean values of the efficiency index for Group 3 hotel properties in two cities are also very different (0.997 in Houston and 0.694 in NYC). However, as aforementioned, Group 3 in NYC has one extremely poor performer (DMU 3_2, efficiency index 0.082). The other two hotel properties show an efficiency index of 1, indicating an efficient frontier.
Table 2. DEA analysis results
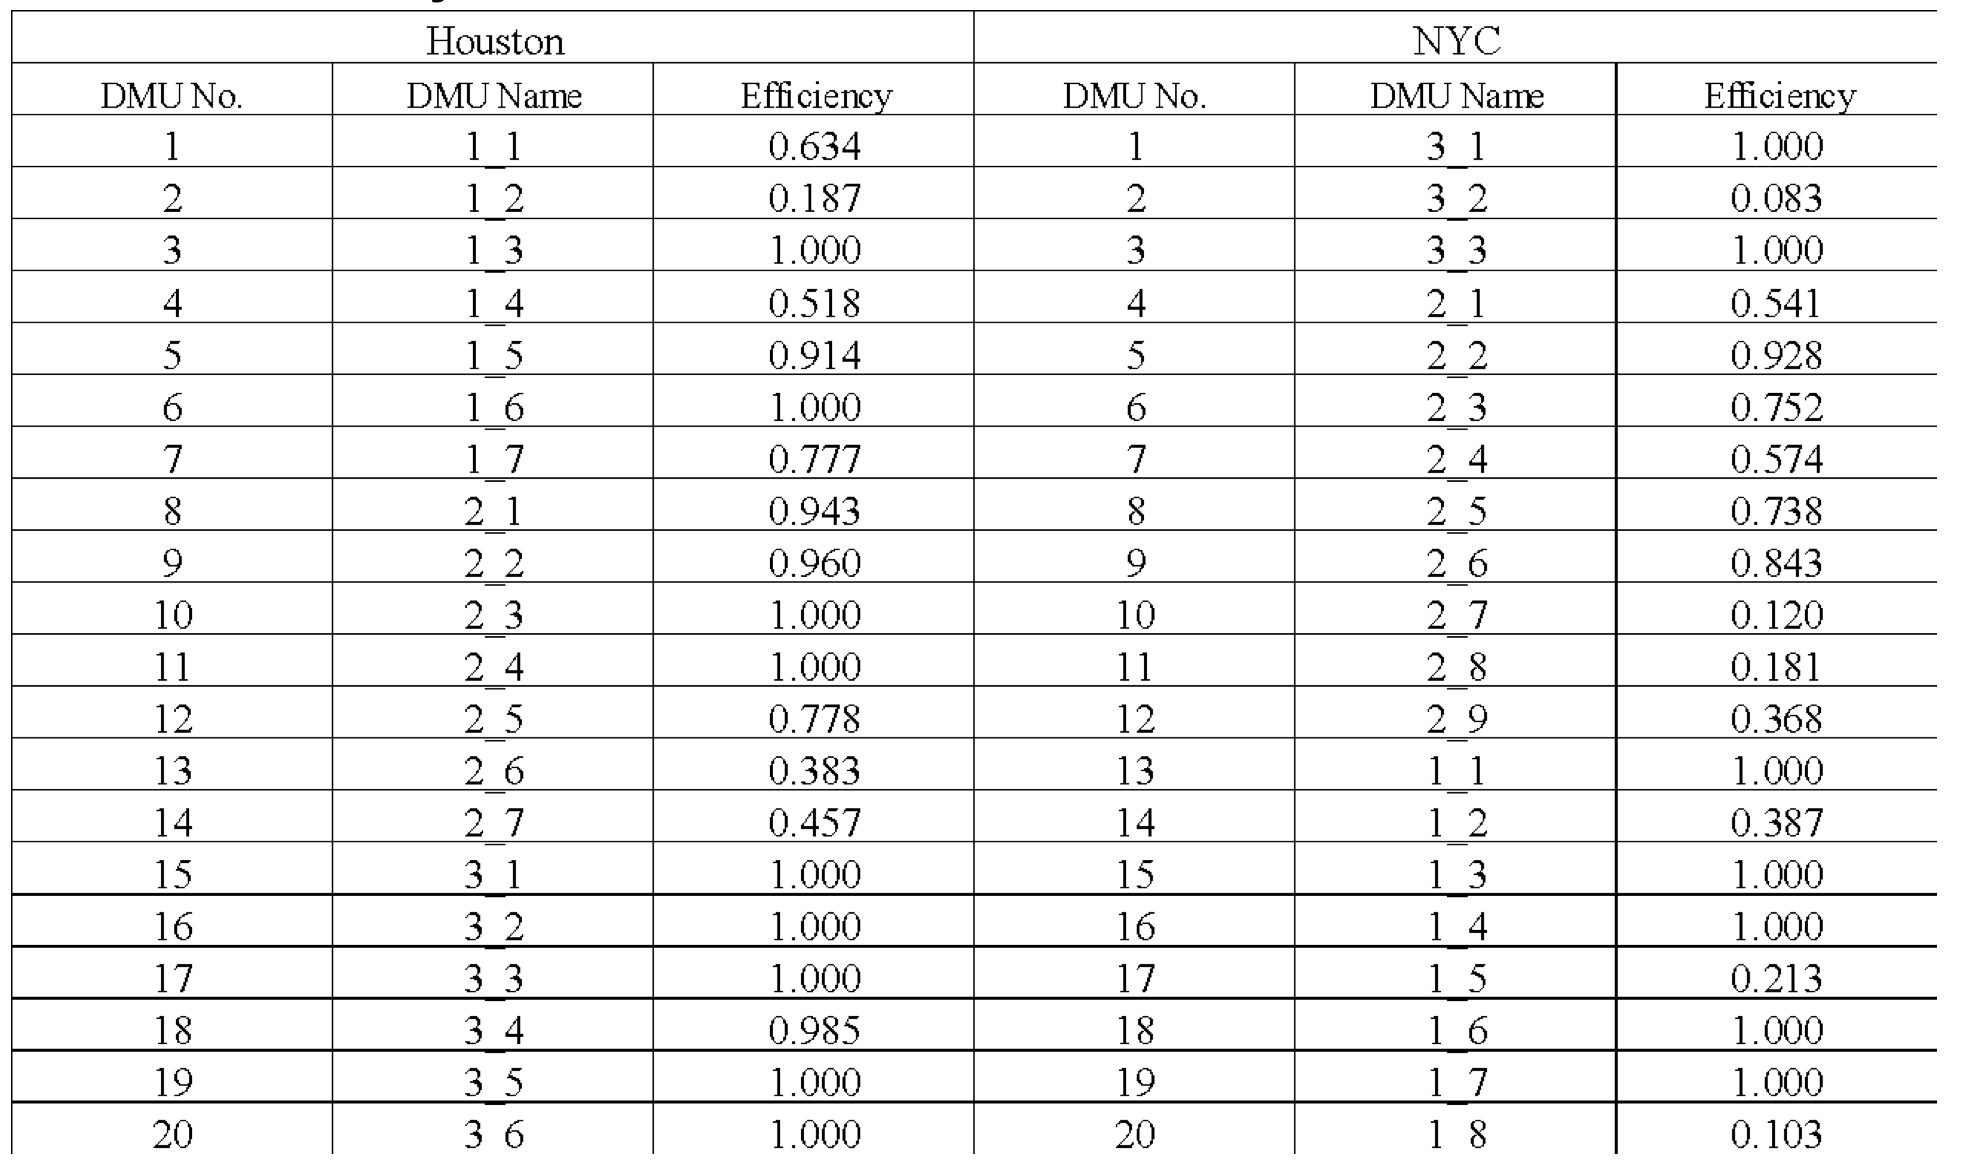
Table 3. DEA indices comparison
Let’s Take Action
What can managers, operators, and owners do to enhance the efficiency of their hotels? While there is a lot of insightful information shared thus far, it is important to understand how the information needs to be interpreted. First, efficiency in this article is the utility of inputs that produce the respective and collective outputs. Thus, the key is to find and maximize the use of the most important inputs in order to enhance the outputs based on the industry and operational characteristics of the hotels, as no one hotel is identical to another. Second, efficiency needs to be defined comparatively based on the competitive sets in a market. Therefore, strategies to enable hotels to reach the efficient frontier that may apply to Houston may not be totally applicable to New York and vice versa, and thus market characteristics play an important role in the decision-making process. As such, the ensuing discussion is organized by hotel class.
Midscale and Economy Properties
As discussed previously, the midscale and economy properties rely heavily on rooms revenue. Therefore, what can midscale and economy hotels do to increase efficiency, especially for the one hotel in NYC that has a very low-efficiency score? Each city and state has its hotel and lodging associations where members meet regularly to share ideas, and vendors showcase their new products to assist operators, managers, and owners to make a higher profit. There is also a main guest speaker for such meetings for the education purpose of the membership. As the scores in Group 3 are high already, with the exception of the one hotel in NYC, perhaps that particular hotel can be more proactive in reaching out to other fellow hoteliers for ideas. Although the hotel industry is competitive, and during meetings, of course, antitrust laws need to be observed, sharing ideas of how to be a better operator and manager helps the industry in the long run. With the power of social media, bad reviews or comments of one hotel may have effects on other hotels in a city. In addition, if travelers have a bad stay in one particular hotel in NYC that ruins their trips, it may become a bad trip in NYC rather than one single poorly operated hotel that leaves a bad taste. Besides regular meetings, these associations also have wonderful websites, e-training, including timely and useful messages on their Facebook pages to assist their membership (e.g., https://houstonhotels.org, https://www.facebook.com/HoustonHotelAssociation/, https://hanyc.org).
Upscale and Upper-Midscale Properties
As a group, the 0.788 score of the seven properties in Houston translates to a target input decrease of 21% to achieve efficiency, while the NY group with an efficiency score of 0.560 has a bit more work to be considered. Due to the differences in market characteristics, the number of travelers in both cities, their reasons for travel (business or leisure), their needs and wants are also very diverse. Thus, the guest demographics, together with the resources input of hotels in this group, should all be included in finding proper efficiency strategies among competitive sets.
This article uses seven different inputs, and three of those are expense related. Expenses can include labor, food costs (if hotels have food service outlets), undistributed expenses such as marketing and utilities as used in this study, and others. For Houston, perhaps due to the temperature and humidity in the summer months, average utility expense in this group is 13.62% of the total rooms, food & beverage, and spa revenues. This is quite a high percentage. With today’s technology and especially the Internet of Things (IoT), perhaps this expense can be reduced. IoT is the inclusion of internet connectivity within everyday devices and appliances that have not typically had such capabilities. By linking them to the internet, they become smart. Hotels have been using this technology to control all the thermostats in all the hotel rooms. With IoT, the thermostats can now talk to each other. This can improve data collection, increase levels of automation and allow for multiple devices to be controlled or monitored from one centralized place, such as a phone or tablet. With energy and sustainability being important issues in the hotel industry, a firm control on utility costs is a must.
The 0.561 efficiency score for NYC is of some concern as this means the nine hotels in this upscale and upper-midscale group collectively need to target an input decrease of about 44% to achieve efficiency. One item that stands out is that two of the nine hotels only have a score of 0.119 and 0.181, with another one at only 0.367. In addition, on average, when labor cost is divided by total revenue, the percentage is in the high 90%. It is obvious that the three low-scoring hotels pull down the averages, yet none of the nine hotels achieve a 1.0 score (Houston as 2 out of 7 achieving 1.0). Thus, the upscale and upper-midscale hotels in NYC may need to carefully assess their cost structures. Using the Uniform System of Accounts of the Lodging Industry and also benchmarking reports from STR, CBRE or HotStats, hotels can benchmark their performance line by line for each major expense. CBRE publishes its Trends report every year around June. STR and HotStats even dissect the data further and assist hotels to select their proper competitive sets with the right market and characteristics so the comparison can be meaningful and thus the strategies set can be targeted and effective.
Luxury and Upper-Upscale Properties
There are only two ways to bring more value to the bottom-line of any business, and this also applies to the hotel industry: increase sales and decrease costs. The luxury and upper-upscale group is different from the other two in that it has various sources of revenues, not only rooms. Thus, while it is true that these hotels have opportunities to achieve efficiency, it also has options to increase revenues to bring profits to the bottom line. Although the Houston and NYC markets have very similar efficiency scores, the percentage of their sources of revenues and also some of their expenses are quite different. Thus, depending on the various characteristics, the implications can be very different for these hotels in the two markets to achieve efficiency.
On average, of the seven properties, the Houston luxury and upper-upscale hotels made 34.0% of its total revenues from rooms, but 62.8% from food and beverage and 3.2% percent from spa. The rooms department should have the lowest cost of all departments because its departmental expenses are mainly labor and the direct costs such as laundering the linen, replacing amenities, etc. On the other hand, for the food and beverage department, food cost alone can be 30-40% of the total food and beverage revenue. Thus, the Houston group may want to increase its rooms revenue to balance the sales mix. At an occupancy of 58.8%, there are a lot of rooms left unsold. Perhaps these hotels can put together special get-away packages, even for weekdays (especially in the summer months or during the winter holidays when school is out), cater to the family unit, and have them relax at your hotel to experience a “Sun and Fun” trip. These luxury hotels have swimming pools and even lazy rivers that families can enjoy. By adding discounted spa treatments for the moms, and maybe also for the dads, while providing onsite childcare, it is a win-win for everyone. At the same time, when looking at reducing the input to achieve efficiency, the Houston group spent 19.2% of their total revenue on marketing on average, almost doubling the NY group’s 10.6%! Perhaps the marketing strategies should be revisited to see if there are better means for hotels to reach their target guests.
Of the eight properties in NYC, while the group efficiency score is almost the same as Houston’s, the individual efficiency scores showed a different story with five hotels achieving the perfect 1.0 score, and the other three received scores of 0.10, 0.21, and 0.39. It would be interesting to see if these three are new properties, independently owned, located in different boroughs of New York, or to assess their guests’ profiles because the scores are so different. Knowing some of these characteristics can help to generate specific strategies for these three properties. The sales mix of the NYC group came in at 45.5% rooms, 52.6 % food and beverage, and 1.9% spa revenue. At an average occupancy of 73.5%, which is quite commendable, perhaps increasing the spa revenue and food and beverage revenue would be more appropriate strategies for this group. However, this does not mean the Group 1 hotels in NYC should not monitor their occupancy level either since the rooms department is still the highest GOP producer due to its lowest cost structure. Specials for spas can also be marketed to locals in addition to the hotel guests as an additional source to increase spa revenue. In terms of expenses, again, the labor cost percentage of the NYC group is very high. This can partly be due to the pay scale difference between the two cities. And while marketing and utilities expense percentages are good, the three hotels that have the low-efficiency scores do need to look at not just marketing and utilities but all other costs to make sure they are in line with their competition
The ramping up of the global travel industry will undoubtedly pose more uncertainty and challenges to the hotel industry. Efficiency, therefore, more than ever, is an important risk-hedging strategy, and hoteliers need to capitalize on every single internal source and commoditize them with the best cost-saving strategies in order to succeed and to survive.
References
17 comments
I would like to leave a website for good accommodation in Phuket. in Thailand VILLA FOR RENT Thanks for the comment area.:)
Garden decoration is a good time in the past because it demanded. give you skills Creativity and experimenting with unused waste in the house or backyard. New ideas. จัดสวนหน้าบ้าน
Appraisal price per plot of the Treasury Department, conversion cost, cost of living for land surveying Fee fees, surveyor queues, and also show the city plan, good use of the land. ค้นหารูปแปลงที่ดิน
บ้านน็อคดาวน์ A knock-down house can last up to 50 years if quality building materials are used. strong house structure located in a good environment no natural disaster No termites and other insects infested and well maintained. Knock-down houses have long been popular in Japan and some European countries.
Recommended websites, detached houses, twin houses, information introduction, single houses, housing estates, second-hand houses, townhomes, townhouses with elegant design, you can be proud. think every detail of living in Phukhet >>>> บ้านจัดสรรภูเก็ต
Recommended websites, detached houses, twin houses, information introduction, single houses, housing estates, second-hand houses, townhomes, townhouses with elegant design, you can be proud. think every detail of living in Phuket Villas Phuket
Recommen ded websites, detached houses, twin houses, information introduction, single houses, housing estates, second-hand houses, townhomes, townhouses with elegant design, you can be proud. think every detail of living บ้านสองชั้นสวยๆ
Beautiful house colors สีบ้านสวยๆ
Websites, detached homes, twin homes, information introduction, single homes, housing developments, pre-owned homes, townhomes, and townhouses with beautiful designs are all recommended. Consider every aspect of life. basketball stars
we some papers related to hotels efficiency
I need some papers related to hotels efficiency
percetakan Thank you for help me in this article, This is good to me ang many.
students navigating the complexities of anthropology or other academic disciplines, https://assignmentbro.com/ca/anthropology-assignment-help
Fantastic blog I have never ever read this type of amazing information. Sherlock Coat
I trust you post again soon… mcm varsity jacket
The way you talked about styling is unique and classy. Keep doing the wondrous work. The Grinch Costume