What do guests value most in Airbnb accommodations? An application of the hedonic pricing approach
By Tarik Dogru and Osman Pekin
The sharing economy has become a major phenomenon; Airbnb, Uber, ZipCar, Kickstarter and many more comprise the rapidly expanding list of pioneers in the world of the sharing economy. This new concept has introduced an alternative platform for consumers, widely known as peer-to-peer marketplace, in which participants are motivated by the idea of “what’s mine is yours” (Botsman, 2010). Unlike traditional businesses, the concept of the sharing economy is a two-way street wherein users at both ends can benefit either as consumers, suppliers, or both. Sharing economy platforms allow people to share their underutilized properties through user-friendly websites or mobile applications with relatively lower transaction costs and usually at a lower rate compared to those of traditional businesses. Thus, many people have started to participate in sharing economy platforms because of the economic and financial benefits it provides both for consumers and suppliers. In particular, these platforms provide cost-saving benefits and convenience to the consumers, while allowing suppliers to generate extra income (Mohlmann, 2015).
Participants of sharing economy platforms, however, have indicated that social benefits are more important than the economic and financial benefits that sharing economy platforms provide (Tapio & Airi, 2015). Indeed, consumers may perceive differently the value of services offered through sharing economy platforms than they do the value of traditional businesses. For example, consumers may value the sociability, trustworthiness, and friendliness of their Airbnb hosts and the experience they enjoy during their stay (Mody, Suess, & Lehto, in press). However, the value placement might be more closely tied to the dollars consumers spend. That is, the way consumers perceive the benefits from goods and services is likely to be different in sharing economy platforms. While traditional businesses are slow to keep up with these changes, the mutually beneficial characteristics of sharing economy platforms seem to be one of the main reasons behind the significant growth of the sharing economy marketplace, which is now considered a major threat by traditional businesses.
Airbnb, the largest accommodation firm in the sharing economy marketplace, has about 3 million listings, including entire homes, shared rooms, and private rooms, which is more than world’s largest three hotel chains combined (IHG, Marriott, Hilton, 2.58 M listings). Over five years, it hosted about 50 million guests, 30 millions of whom were hosted in 2015 alone (Airbnb Summer Travel Report, 2015). In a recent report, STR showed that Airbnb currently has around 9% of the market share in terms of supply. Although Airbnb supply dynamics are much more flexible than those of traditional accommodations, such a large supply capacity might create a substantial threat to the lodging industry (Haywood et al., 2017).The remarkable volume of listings and record-breaking growth in number of guests has caused Airbnb to be recognized as a “disruptor” for the lodging industry (Guttentag, 2015). Critics of the sharing economy argue that if Airbnb did not exist or if it were to operate by the same rules that traditional lodging firms do, then most, if not all, of the room nights would be booked in traditional hotels. In a recent study, researchers found that a one percent increase in the number of Airbnb listings decreased hotel room revenue by 0.5% in Texas (Zervas, Byers, & Proserpio, 2017). These results provided support for the concerns expressed by stakeholders in the lodging industry that the growth of sharing economy platforms is likely to adversely affect the lodging industry’s revenue stream. Furthermore, if the hotel demand were to be shifted to Airbnb, hotel developments in the pipeline might create an overinvestment problem in the market (Dogru, 2017a).
The impact of Airbnb on large lodging corporations’ revenue streams does not necessarily suggest that Airbnb will disrupt the overall economy or local economies. In other words, despite the potential adverse effects of the sharing economy on traditional business platforms, the sharing economy could instead provide positive economic benefits for local communities and the tourism industry by generating new jobs and new sources of income (Fang, Ye & Law 2015). According to an economic impact study conducted by Airbnb, guests spent $352 on average in the neighborhood where they stayed, supporting 490 jobs with an overall economic impact of $51 million from July 2013 to June 2014. The company also suggests that this sharing economy platform helped conserve energy equivalent to 220 homes in Boston during this period. Similar findings were also reported in other major cities in the US and around the world. Although these reports might be biased and independent studies should be conducted to determine the economic impact of Airbnb, these findings point out the flip-side of the coin and provide insight about potential positive impacts of the sharing economy on local economies.
Regardless of the potential economic, social, and environmental impacts, whether they be positive or negative, Airbnb should be considered one of the major competitors in the lodging industry, considering its market share and value (Dogru, 2017b). Recent efforts of the lodging industry to “ensure [regulatory] legislation in key markets” suggest that the industry indeed considers Airbnb to be such a major competitor (Benner, 2017). Therefore, understanding what drives consumers to book Airbnb accommodations becomes necessary for the hotel industry in developing strategies to compete with Airbnb. The physical (i.e., space, location, amenities, etc.) and non-physical (i.e., sociability, trustworthiness, friendliness, etc.) attributes, which are reflected on the price of the Airbnb accommodations, may play a crucial role on Airbnb guests’ decision making. In other words, the price of Airbnb properties is determined based on the value consumers place on the attributes of Airbnb accommodations. Therefore, examining the price determinants of Airbnb properties may play a crucial role in understanding the factors that drive the growth of the sharing economy based accommodation services. This study examines the price determinants of Airbnb properties listed in the city of Boston using the hedonic pricing approach.
Studies that have investigated the pricing determinants of sharing economy-based services are limited. A number of studies have examined the effects of reviews, ratings, and host photos on the prices of Airbnb accommodations. Hosts awarded a “Superhost” badge, a status given to hosts with a good standing and excellent service standards, post their properties at higher prices, especially when they receive more reviews and higher ratings (Liang, Schuckert, Law & Chen 2017). Furthermore, studies have shown that guests determine the trustworthiness of hosts from their photos and are willing to book more expensive Airbnb properties if the hosts seem to be trustworthy. However, online reviews and ratings did not appear to have an effect on the listing price (Ert, Fleischer, & Magen, 2015). These results can be attributed to the fact that, on average, Airbnb hosts have a rating of 4.5 out of 5, which is very extreme compared to hotel firms’ ratings (Zervas, Proserpio, & Byers, 2015). Analyzing the price determinants of Airbnb accommodations in 33 cities, where demand and supply dynamics for accommodation services are likely to be different, Wang and Nicolau (2017) found results similar to those of the hotel industry (see e.g., Chen & Rothschild, 2010).
In general, factors related to the site and property characteristics, amenities, services, rental rules, and customer reviews significantly affect the prices of sharing economy-based accommodations. In particular, Airbnb listings that offer amenities such as real beds, wireless Internet, and free parking had higher prices compared to those that lacked these amenities. Although the city of Boston was included in this study, the time period studied was limited to October 2015, and Boston was defined as the greater Boston area. In our study, we analyzed the price determinants of Airbnb accommodations in the city of Boston, and we included properties listed during the period of January, 2015 to September, 2016. Although the price determinants might vary greatly from one city to another, the former study analyzed these determinants using aggregate data from 33 cities around the globe. Therefore, it is necessary to conduct a city-level analysis to identify the price determinants more accurately.
Analysis
The data was obtained from Airdna, which is a company that provides data and analytics to entrepreneurs, investors, and academic researchers (Airdna, 2017). Airbnb listings with no reviews were removed from our analysis in order to provide more accurate estimates, as Airbnb listings with at least one review will be closer to the market equilibrium price. The final sample consisted of 2,699 Airbnb properties listed between 2015 and 2017. Table 1 presents the summary statistics of the dependent and independent variables used in this study, along with minimum and maximum values of these variables where applicable.
| Table 1. Summary Statistics | ||||
| Variables | Mean | Std. Dev. | Minimum | Maximum |
| Dependent Variable | ||||
| Published Rate | 215.12 | 214.17 | 10 | 10,000 |
| Space Attributes | ||||
| Entire Home | 0.70 | 0.45 | ||
| Private Room | 0.27 | 0.44 | ||
| Shared Room | 0.03 | 0.17 | ||
| Quality Attributes | ||||
| Cleaning Fee | 0.70 | 0.45 | ||
| Overall Rating | 92 | 9.40 | 20 | 100 |
| Number of Reviews | 18 | 32.31 | 1 | 374 |
| Number of Photos | 12 | 9.19 | 0 | 105 |
| Superhost Badge | 0.09 | 0.28 | ||
| Friendliness | ||||
| Pets allowed | 0.12 | 0.33 | ||
| Handicap Accessible | 0.06 | 0.24 | ||
| Family Friendly | 0.46 | 0.49 | ||
| Freebies | ||||
| Kitchen | 0.94 | 0.23 | ||
| Washer | 0.69 | 0.46 | ||
| Dryer | 0.69 | 0.46 | ||
| Free Parking | 0.05 | 0.22 | ||
| Breakfast Included | 0.06 | 0.23 | ||
| Commerciality Attributes | ||||
| Suitable for Events | 0.04 | 0.19 | ||
| Business Ready | 0.17 | 0.38 | ||
| Hosts with Multiple units | 18.34 | 45.65 | 1 | 242 |
| Location | ||||
| Distance from City Center | 3.25 | 1.39 | 0.19 | 7.24 |
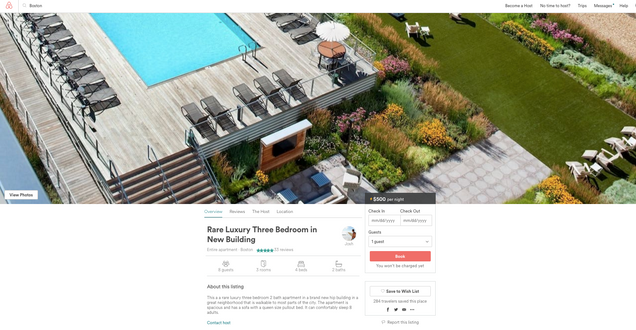
The dependent variable, the published nightly room rate, averages $215 in the city of Boston and ranges anywhere between $10 and $10,000. We classified the attributes of Airbnb accommodations, which are the independent variables of this study, into six categories. Exhibit 1 shows the attributes of a luxury Airbnb accommodation in Boston.
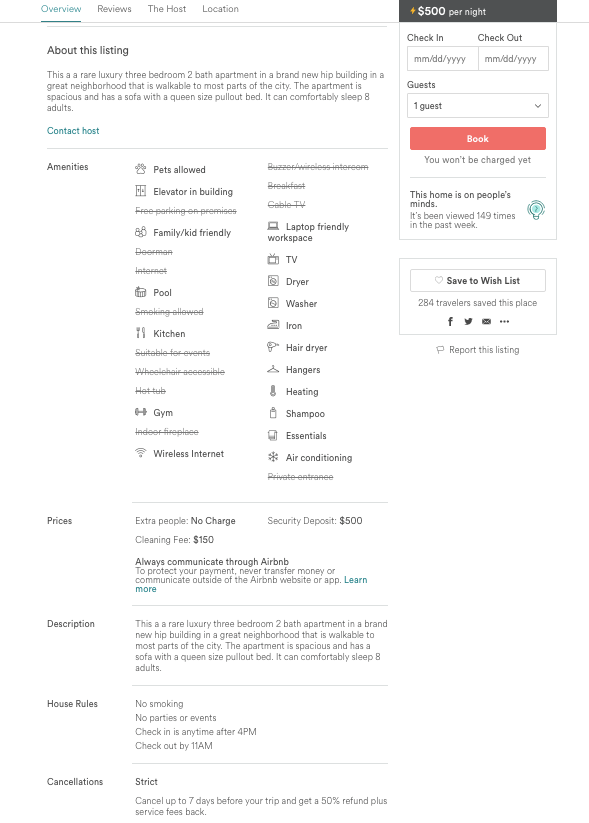
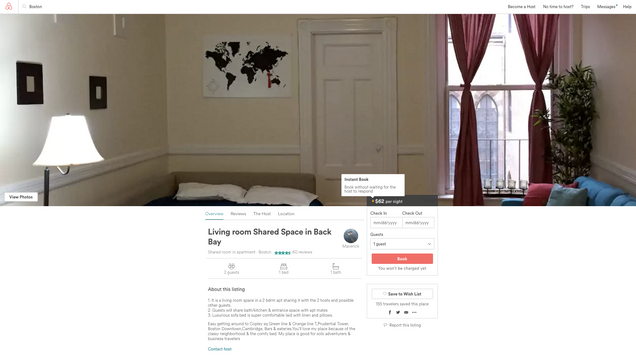
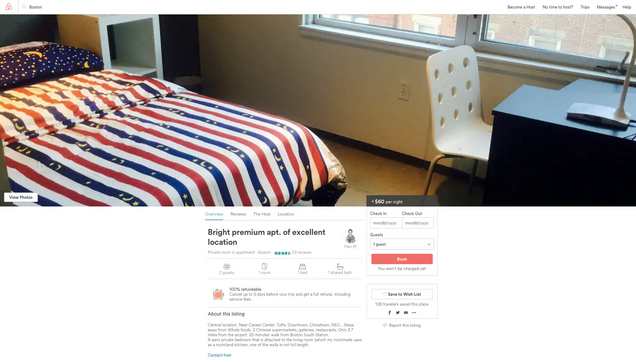
Space attributes include entire homes, private rooms, and shared rooms. According to these results, 70% and 27% of the Airbnb listings are entire homes and private rooms, respectively, whereas only 3% of Airbnb listings are shared rooms. Exhibits 2, 3, and 4 illustrate examples of Airbnb listings in Boston.
Quality attributes consist of the cleaning fee, overall ratings, number of reviews, number of photos, and the Superhost Badge status. A major percentage (70%) of Airbnb hosts require a cleaning fee. While overall ratings vary greatly between 20 and 100, on average hosts receive an overall rating of 92. Further analysis showed that there were only 242 hosts with an overall rating below 80. The data for the number of reviews indicates the number of times an Airbnb property was booked, since only people who have stayed in a property are allowed to provide a review. On average, Airbnb hosts had 18 reviews or stays during the study period. Airbnb hosts on average posted 12 photos of their properties, and only 9% of the hosts had the Superhost status.
Friendliness attributes define whether the property listed is pet-friendly, handicap accessible, and family-friendly. Only 12% of the properties studied allow pets. While 46% of the Airbnb properties listed in Boston are family-friendly, only 6% are handicap accessible.
In general, a kitchen and laundry services are the amenities most commonly offered in an Airbnb property. In Boston, 94% and 69% of the hosts offered access to a kitchen and the use of washer and dryer, respectively. Furthermore, the percentage of Airbnb hosts who offered free parking and free breakfast were about 5 and 6%, respectively.
As we define it, the commerciality category includes attributes like suitability for events, business-readiness, and hosts with multiple units. Only 4% of the Airbnb properties are suitable for events and about 17% are business-ready. On average, a host has 18 units listed on Airbnb. More strikingly, some hosts in Boston have 242 properties, whether they be entire homes, private rooms, or shared rooms, listed for rent.
The last attribute category is the location, which represents the geographic distance of an Airbnb property from the city center. Distance from the city center seems to be low—3.25 miles on average—suggesting that most of the properties are in close proximity to the city center, which may create a convenience to the guests.
We examined the price determinants of Airbnb properties utilizing the ordinary least squares regression technique. In particular, we analyzed the effects of space, quality, commerciality, friendliness, freebies, and location factors on the nightly published rate of Airbnb listings. Table 2 presents these results.
| Table 2. Price Determinants of Airbnb Accommodations | ||||
| (1) | (2) | (3) | (4) | |
| Space Attributes | Coefficient | t-statistics | Significance | Relative |
| Entire Home | 0.88 | 15.60 | *** | 141% |
| Private Room | 0.25 | 4.33 | *** | 28% |
| Quality Attributes | ||||
| Cleaning Fee | 0.16 | 8.14 | *** | 17% |
| Overall Rating | 0.005 | 5.38 | *** | 0.5% |
| Number of Reviews | -0.001 | -8.00 | *** | -0.4% |
| Number of Photos | 0.01 | 10.11 | *** | 1% |
| Superhost Badge | 0.05 | 1.80 | * | 5% |
| Friendliness | ||||
| Pet friendly | -0.02 | -0.72 | -2% | |
| Handicap Accessible | 0.11 | 3.26 | *** | 11% |
| Family Friendly | 0.10 | 5.43 | *** | 10% |
| Freebies | ||||
| Kitchen | -0.15 | -3.73 | *** | -14% |
| Washer | 0.06 | 1.04 | 6% | |
| Dryer | 0.10 | 1.71 | * | 10% |
| Free Parking | -0.002 | -0.06 | -0.2% | |
| Free Breakfast | 0.11 | 2.88 | *** | 11% |
| Commerciality Attributes | ||||
| Suitable for Events | 0.06 | 1.52 | 6% | |
| Business Ready | -0.04 | -1.88 | * | -4% |
| Hosts with Multiple units | 0.001 | 6.25 | *** | 0.1% |
| Location | ||||
| Distance from City Center | -0.01 | -1.84 | * | -1% |
| Notes: The dependent variable is published nightly rate. ***, **, and * denotes 0.01, 0.05, and 0.1% statistical significance level respectively. | ||||
Key findings can be summarized as follows.
- Entire homes and private room prices are 141% and 28% higher than shared rooms, respectively.
- The prices are 17% higher for Airbnb accommodations that require a cleaning fee compared to Airbnb properties that do not require such fees.
- Overall ratings positively affect Airbnb listing prices, albeit only slightly.
- Posting more photos of the Airbnb accommodations positively affects prices at a corresponding rate. That is, a 1% increase in number of photos increase prices by 1%.
- Airbnb accommodations listed by superhosts have 5% higher prices compared to those of hosts without such status.
- The price increases 10% if Airbnb accommodations are handicap accessible.
- Family-friendly Airbnb accommodations have 11% higher prices.
- Offering access to a washer and dryer increases prices by 6% and 10%, respectively.
- Serving free breakfast increases prices by 11%, compared to the Airbnb accommodations that do not offer free breakfast.
- Airbnb accommodations that are suitable for events have 6% higher rates.
- A 1% increase in the number of reviews decreases prices by 0.4%.
- The prices of Airbnb accommodations with a kitchen are 14% lower.
- Airbnb listings that are defined as “business ready,” which provide additional amenities for business travelers, have 4% lower prices than those of without this status.
- Prices of Airbnb accommodations decrease with increased distance from the city center.
What do these results tell us about Airbnb hosts and guests and what can hoteliers learn?
The motives driving people to stay in Airbnb accommodations are yet to be determined for certain. Although Airbnb guests might place more value on the sociability, trustworthiness, and friendliness of their Airbnb hosts and the experience, Airbnb guests are, to some extent, economically motivated. That is, Airbnb guests might be specifically comparing Airbnb and traditional hotels for cost-saving purposes. The results of our study showed that Airbnb guests place more value on space, cleanliness, number of photos, handicap accessibility, family friendliness, free breakfast, location, and unique experiences. Based on this information, hotel firms might focus on these factors to attract guests from Airbnb’s consumer base.
Airbnb guests pay more for space and privacy, despite the conception that the sharing economy is a social platform wherein participants are motivated by potential social interactions. While such social interactions may still occur when guests rent entire homes, they either value privacy and hence do not want to live with the host, or they value the space because they are traveling in big groups and they require more area in which to spread out. Despite the potential economic gains, Airbnb guests seem to pay extra for cleanliness. Specifically, Airbnb guests pay an additional cleaning fee that may range between $5 and $700 and also pay 17% higher rates compared to properties that do not require cleaning fees. Airbnb guests pay less for properties that allow access to the kitchen, suggesting that these properties are regular apartments, condos, and houses and that Airbnb guests are not likely to pay extreme prices for staying in such properties. The price difference might rather be due to the rate deviation within Airbnb listings, where unique properties, such as treehouses, villas, and yachts, are posted and guests pay more for the experience. However, further research is required to analyze this issue. Airbnb guests also appreciate and pay more for more photos of the Airbnb properties; however, they pay lower rates for Airbnb properties that seem to have commercial purposes. Previous studies have shown that Airbnb hosts do not seem to utilize revenue management practices, which serve to maximize hosts’ profits, but rather list their properties around the median market price (Tapio Ikkala & Airi Lampinen, 2015). Our results may guide Airbnb hosts in determining their properties’ rates. For example, Airbnb hosts may offer free breakfast and hence increase their rates by about 10%.
In conclusion, Airbnb guests pay higher rates for space, quality, friendliness, and unique experiences. To compete with Airbnb properties, traditional hotels should create more opportunities for unique experiences, post more photos of the hotel and guest rooms and provide a family-friendly environment. In particular, hotel firms might offer alternative packages to attract Airbnb guests, especially when operating at lower occupancies. Hence, it may be the time for hotels to include Airbnb in their competitive sets or regularly track Airbnb demand and supply dynamics, especially in the markets with a large Airbnb presence.
 Tarik Dogru earned his Ph.D. in Hospitality Management from University of South Carolina, and holds Master’s degree in Business Administration from Zonguldak Karaelmas University in Turkey.Prior to joining the Boston University School of Hospitality Administration faculty, he was an adjunct faculty at University of South Carolina (2013-2016) and research assistant at Ahi Evran University (2009-2012) in Turkey. He has taught a variety of courses, including Economics, Finance, Accounting, Hospitality, and Tourism in business and hospitality schools. He is a Certified Hospitality Educator (CHE) and holds Certification in Hotel Industry Analytics (CHIA) from American Hotel & Lodging Educational Institute. Tarik’s research interests span a wide range of topics in hospitality finance, corporate finance, behavioral finance, real estate investment trusts (REITs), hotel investments, tourism economics, and climate change.

Osman Pekin is a recent graduate from the Boston University School of Hospitality Administration. As a student he served as a research assistant and accounting tutor while working as a Food and Beverage Supervisor at the Westin Boston Waterfront Hotel.
References
-
Airbnb Summer Travel Report: 2015 (Rep.). (2015, September). Retrieved April 28, 2017, from Airbnb website: blog.airbnb.com/wp-content/uploads/2015/09/Airbnb-Summer-Travel-Report-1.pdf
-
Airbnb’s Positive Impact in Boston [Web log post]. (2014, December 19). Retrieved April 28, 2017, from http://blog.airbnb.com/airbnbs-positive-impact-boston/?_ga=1.111941184.55555233.1484056735
-
Airbnb’s Economic Impact on the NYC Community [Web log post]. (n.d.). Retrieved April 28, 2017, from http://blog.airbnb.com/airbnbs-economic-impact-nyc-community/>.
-
Airdna. (2017). Airdna Data Service. Retrieved from https://www.airdna.co/services/datafeed
-
Benner, K. (2017, April 16). Inside the Hotel Industry’s Plan to Combat Airbnb. Retrieved April 28, 2017, from https://www.nytimes.com/2017/04/16/technology/inside-the-hotel-industrys-plan-to-combat-airbnb.html?_r=0
-
Botsman, R. (n.d.). The Case for Collaborative Consumption. Speech presented at TEDxSydney, Sydney. Retrieved April 28, 2017, from https://www.ted.com/talks/rachel_botsman_the_case_for_collaborative_consumption
-
Chen, C., & Rothschild, R. (2010). An application of hedonic pricing analysis to the case of hotel rooms in Taipei. Tourism Economics, 16(3), 685-694. http://dx.doi.org/10.5367/000000010792278310
-
Dogru, T. (2017a). Under- vs. over-investment: Hotel firms’ value around acquisitions. International Journal of Contemporary Hospitality Management, 29(8).
-
Dogru, T. (2017b). C-corporation Hotels vs. Hotel-REITs: A Theoretical and Practical Comparison. Boston Hospitality Review, 5(1).
-
Economic Impacts in Boston [Web log post]. (2014, December 19). Retrieved April 28, 2017, from <http://blog.airbnb.com/economic-impacts-boston/>.
-
Ert, Eyal and Fleischer, Aliza and Magen, Nathan, Trust and Reputation in the Sharing Economy: The Role of Personal Photos on Airbnb (January 2016). Tourism Management, 55, 62-73, 2016 Forthcoming. Available at http://dx.doi.org/10.2139/ssrn.2624181
-
Fang, B., Ye, Q., & Law, R. (2016). Effect of sharing economy on tourism industry employment. Annals Of Tourism Research, 57, 264-267. http://dx.doi.org/10.1016/j.annals.2015.11.018
-
Guttentag, D. (2015) Airbnb: disruptive innovation and the rise of an informal tourism accommodation sector, Current Issues in Tourism, 18:12, 1192-1217, DOI: 10.1080/13683500.2013.827159
-
Haywood, J., Mayock, P., Freitag, J., Owoo, K., & Fiorilla, B. (2017). Airbnb & Hotel Performance: An Analysis of Proprietary Data in 13 Global Markets. STR.
-
Ikkala, T., & Lampinen, A. (2015). Monetizing Network Hospitality. Proceedings Of The 18Th ACM Conference On Computer Supported Cooperative Work & Social Computing – CSCW ’15. http://dx.doi.org/10.1145/2675133.2675274
-
Liang, S., Schuckert, M., Law, R., & Chen, C. (2017). Be a “Superhost”: The importance of badge systems for peer-to-peer rental accommodations. Tourism Management, 60, 454-465. http://dx.doi.org/10.1016/j.tourman.2017.01.007
-
Mody, M., Suess, C., & Lehto, X. (in press). The Accommodation Experiencescape: A Comparative Assessment of Hotels and Airbnb. International Journal of Contemporary Hospitality Management.
-
Möhlmann, M. (2015), Collaborative consumption: determinants of satisfaction and the likelihood of using a sharing economy option again. J. Consumer Behav., 14, 193–207. doi: 10.1002/cb.1512.
-
Wang, D., & Nicolau, J. (2017). Price determinants of sharing economy based accommodation rental: A study of listings from 33 cities on Airbnb.com. International Journal of Hospitality Management, 62, 120-131. http://dx.doi.org/10.1016/j.ijhm.2016.12.007
-
Zervas, G., Proserpio, D., & Byers, J. W. (2017). The Rise of the Sharing Economy: Estimating the Impact of Airbnb on the Hotel Industry. Journal of Marketing Research(ja), null. doi:10.1509/jmr.15.0204 %U http://journals.ama.org/doi/abs/10.1509/jmr.15.0204
-
Zervas, G., Proserpio, D., & Byers, J.W. (2015). A First Look at Online Reputation on Airbnb, Where Every Stay is Above Average SSRN Electronic Journal. https://ssrn.com/abstract=2554500
11 comments
Thanks For Sharing The Very Informative blog really very very Helpful keep it up. also, Visit:- Magento 2 Catalog Rule Per Store View Extension
Dear Tarik Dogru and Osman Pekin,
Thank you for sharing your research on what guests value most in Airbnb accommodations. Your use of the hedonic pricing approach provided valuable insights into how guests prioritize different aspects of their stay, such as location, size, and amenities.
One aspect that stood out to me was the importance of cleanliness in driving guest satisfaction and willingness to pay higher prices. As a business owner in the cleaning industry, I believe that this finding underscores the value of starting an Airbnb cleaning business.
In my recent blog post, “How to Start an Airbnb Cleaning Business,” I discuss the steps that aspiring entrepreneurs can take to establish a successful cleaning service for short-term rentals. By prioritizing attention to detail, using the latest cleaning technologies, and building strong relationships with clients, individuals can tap into the growing demand for reliable and thorough cleaning services in the hospitality industry.
I would encourage readers who are interested in starting their own Airbnb cleaning business to check out my blog post for more information on this exciting opportunity. With the right strategies and a commitment to customer satisfaction, starting an Airbnb cleaning business can be a smart investment for anyone looking to enter the hospitality industry.
Thank you again for sharing your research, and I look forward to reading more of your posts in the future.
Best regards,
Liam Shapley