Product Life Cycle: Moving from Theory to Practice
By: Stanley I. Buchin, D.B.A.
Last year, restaurant trends stretched from a rise of dining in retail stores to paleo and gluten-free menus. According to Baum + Whiteman 2015 Food & Beverage Forecast, this year’s trends will include technology like tablets immersed into the dining experience, expanding on diners restless palates who have had enough Sriracha, bacon, and craft beer, and creating new concepts to fill in a restaurant or bar’s “down time”. With trends changing so rapidly, restaurants and bars must be more proactive than ever before to continuously stimulate business and prepare for a products natural life cycle (PLC).
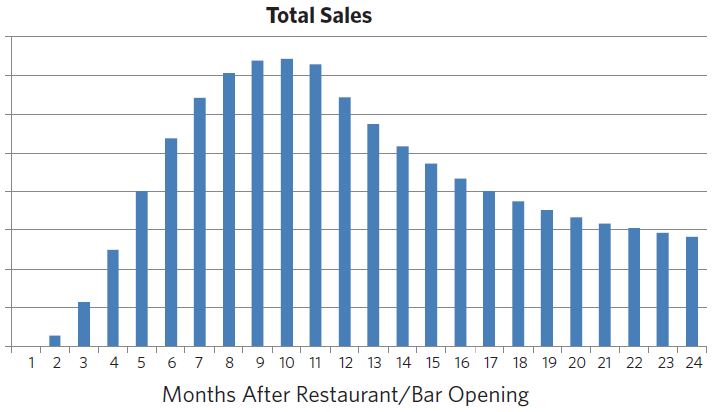
According to Dr. Jean-Paul Rodrigue of Hofstra University, product life cycle is “the period that starts with the initial product design (research and development) and ends with the withdrawal of the product from the marketplace” and is characterized by four stages: introduction, growth, maturity, and decline. A typical product life cycle observes rapid growth in its first eight months followed by a gradual decline to plateau as customer populations are depleted, and as trends and needs shift. As a business owner in today’s market, it is vital to understand product life cycle and how to apply current trends to strategically stimulate business.
This article explores a model of predicting PLC and strategic practices that can extend the mature phase of a restaurant or bar.
First-time Trial Customers
Product life cycle is partly caused by a combination of two types of customers, first-time trial and repeat. Trial purchasing follows the typical pattern of rapidly increasing purchases during the first seven months of business and steadily decreasing as the population of first time customers is exhausted.
This is a result of the following new customer behavior:
• Customer first-time trial purchases start slowly while the market is first learning about the new restaurant or bar.
• New first-time customer interest begins to surge several months after the restaurant or bar opens until it hits a peak.
• New customer interest falls off after this peak and gradually drops off to zero (or a very small fraction of the market, when you run out of new first-time customers in your target market.)
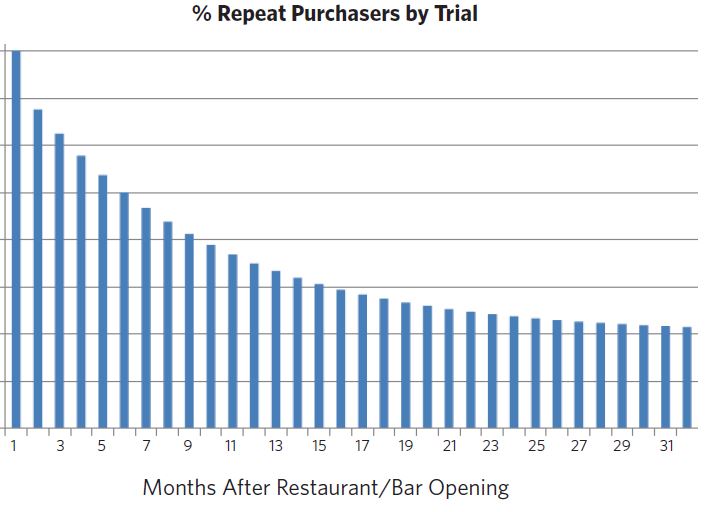
Repeat Purchasing Behavior
Each group of first-time customers has the following typical subsequent repeat purchasing behavior:
This repeat purchasing behavior has the following characteristics:
• Only some fraction of the trial customers will return to the restaurant or bar for a first repeat visit.
• This fraction will decline for subsequent repeat visits.
• The rate of decline depends on two major drivers;
• Customer satisfaction with the products/services being offered
• Number and strength of new products/services being offered

Forecasting Future Behavior of New Trial and Repeat Purchase Behavior
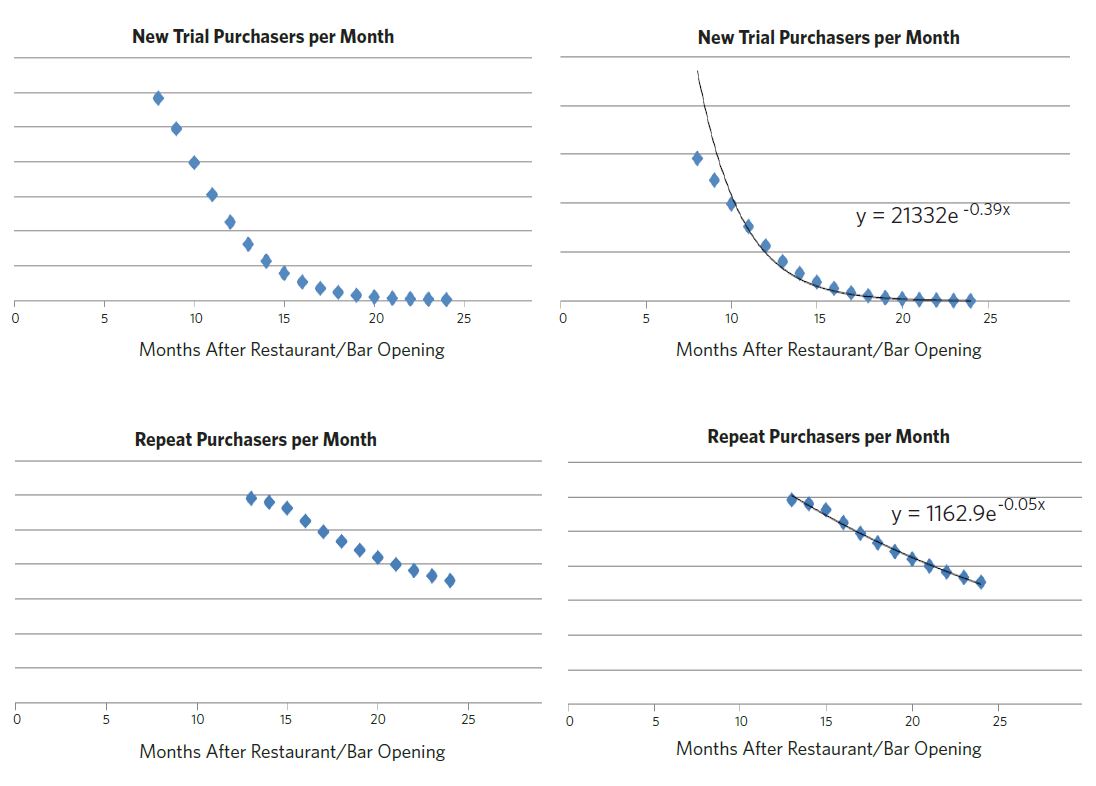
Once a restaurant or bar has reached its peak monthly new trial and repeat demand, the following purchase behaviors are observed (Graph 1, Graph 2).
An Excel regression analysis can be used to fit an exponential curve, like the new trial purchase behavior after its peak performance, to the actual observations.
In Excel terms, the “best fit” exponential equation has the following format:
New trial purchasers per month = Constant1 * EXP(-Constant2 * Months since opening of restaurant/bar lounge)
Repeat purchasers per month = Constant3 * EXP(-Constant4 * Months since opening of restaurant/bar lounge)
This “best-fit” exponential equation yields forecasts of new trial or repeat purchase behavior for future months.
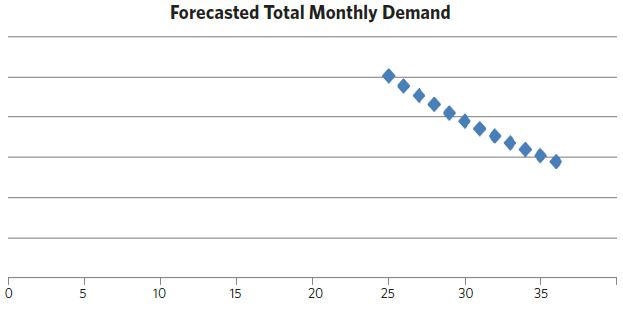
Forecasting Total Demand
Customer visit and spending data is used to convert the above customer forecasts into monthly demand forecasts. This information is usually determined by using both trial and repeat customer purchasing information from market research and/or internal financial data.
The primary data requirement for tracking the product life cycle of a restaurant/bar is the ability to differentiate between the purchases of first time trial customers and repeat customers. Even if information is not available for 100% of the customers, a sample of the customers is usually sufficient.
The forecasts below were determined using the above “best-fit” regression equations from step one, and converting them to demand forecasts.
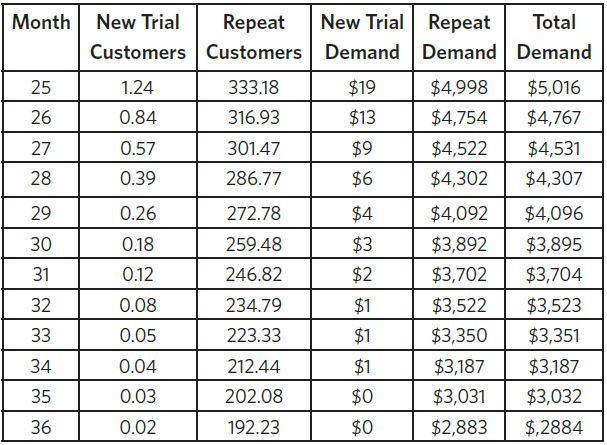
These are then converted to demand forecasts using the equation:
Demand = Customers x Average number of visits per month x Average spending per visit
If the breakeven demand per month was $3,000 per month, our forecasts indicate we will reach this level by month about month 35 or 10 months from today if this is calculated in month 25. It is now known that corrective action is vital and within just 10 months.
Corrective Actions to Reverse Declining Purchasers per Month
Corrective actions such as introducing new products, like McDonald’s and their breakfast menu, re-branding, or changing target markets should be strategically decided upon, taking the mission, brand, goals, and market into consideration. There are two dominant classes of corrective actions:
• Stimulate new first-time trial purchasers
• Stimulate repeat purchase purchasers
Stimulating New Trial Demand
Stimulating first-time trial customers typically involves basic, but risky, actions. If carefully determined and employed, successfully stimulating trial customers come with higher return. Properly engaging new first-time customers at a restaurant or bar requires the following criteria:
• Finding new target markets that the current restaurant or bar does not currently appeal to
• Re-theming the restaurant or bar to make it feel like a new product.
• Offering a new menu that is perceived in the market as being significantly different from the current menu.
In-depth target market research is key to deciding which markets will be worth the risk of making major changes to a restaurant or bar. After deciding on the most valuable target market, a combination of the following can be used to stimulate these potential new customers (in order of decreasing risk):
• Relocating the establishment
• Re-theming the current restaurant or bar
• Making major revisions in the restaurant or bar current menu offerings and prices
Currently, Starbucks is rolling out new plans to make food sales account for 25% of total sales by fiscal year 2019, up 9% from 2010 by adding high quality menu items that will capitalize on breakfast and the especially under-utilized lunch customer. Even more, the coffee company plans to introduce evening hours and menu items, like wine, to approximately 2,000 stores (almost 25% of their portfolio) by fiscal year 2019. Meanwhile, it’s more casual competitor, Dunkin’ Donuts instilled ‘happy hours’ at many of its franchises, offering discounted drinks during late afternoon hours.
Stimulation of Repeat Purchase Demand
Narrowing an establishment’s focus on operations and service quality is often the base of stimulating repeat customers and include the following strategies:
• Operations focus on service quality and customer satisfaction
• Customer loyalty programs
• Special pricing for repeat customers
• Online restaurant reservations
In 2014, Chili’s installed tablets at every table in its 823 restaurants allowing customers to order appetizers, desserts, and drink refills, plus play interactive games and pay their bill all from the personal device. The strategy was meant to not only increase revenue through additional beverage, food, and gaming sales, but to increase customer satisfaction as they now have the ability to pay their bill faster.
Starbucks and Dunkin Donuts have both created repeat customer strategies using customer loyalty programs and special pricing programs. Both coffee shops have popular mobile apps that reward customers with points for every purchase like free or discounted drinks, food items, or the coveted premium Starbucks Gold Card, and encourage easy mobile payment directly from a customer’s phone.
Starbucks took the “happy hour” strategy one step further by providing afternoon discounts to morning customers who brought their receipt back between 3-5pm to make another purchase.
Classic Stimulation: McDonald’s Breakfast
By 1975, successful fast-food chain, McDonald’s had been in business for 27 years and remained loyal to hamburgers with a few additions including chicken, fish, roast beef sandwiches, and the legendary Big Mac. Wanting to increase new and repeat customer visits, franchisee owner Jim Delligatti sought to fill the morning hours with profitable menu items. After trial and error with coffee, doughnuts, sweet rolls, pancakes and sausage, the Egg McMuffin sandwich was developed, turning new profits and making the additional business hours worthwhile. The creation of a popular breakfast menu stimulated customer behavior and has remained strong; breakfast items make up 15% of McDonald’s annual sales.
As hospitality trends and consumers needs rapidly change, the product life cycle and brand loyalty of a typical restaurant or bar is trending shorter. Combining market and customer data, current and predicted trends, and by calculating an establishments product life cycle, it is possible to develop corrective strategies to remain a strong, profitable brand.
12 comments
I feel that your blog is a good site that provides useful information to anyone. I respect you and ask you to visit my site
Shopify Development Company In Jaipur
Thank you so much for sharing your thoughts. This is exactly what I needs.
Acquire online Astrology Predictions in India
Yeah! This is very interesting post. I look forward for seeking more on your website.
Indian Astrology Future Career Predictions
Hey thank you!!! I was seeking for the particular information for long time. Good Luck
Private Limited Company Registration
Thanks for sharing this information.
Company Registration In Mumbai
Great choice! Tower Defense games are always fun. Which Tower Defense game would you like to play?
It’s so awesome. It shows that this is a good sign
Thank you!
Instead of concentrating on one genre,
free games offer games from various genres.
Great blog on Product Life Cycle. Every bit of detail is worth it.
Get Company Registration in Mumbai | GST Registration | Trademark Registration in india | MyEfilings.com
Nice post. Thank You for sharing.
wire Mesh in Oman, Sharjah, UAE – Al Miqat Hardware
google
that’s bullshit you’re talking about, I like playing papa’s games better.