Boston Market Hotel Review
By Andrea Foster
PKF Consulting USA (PKFC) and PKF Hospitality Research (PKF-HR) are respected sources for sound decision-making in the hospitality and real estate industries. We apply our skills to discover the unique aspects of an opportunity for our clients, and to develop practical solutions that can be initiated efficiently, successfully, and profitably. Core areas of expertise include applied research, market studies, real estate appraisals, asset management, financial benchmarking, and econometric forecasting.
Performance and forecast data used in this article are sourced from PKFC’s Boston Trends in the Hotel Industry® and PKF-HR’s Hotel Horizons® September-November 2014 Edition. Boston Trends® compiles performance data from approximately 100 hotels in the Greater Boston area, published in a monthly report used by hoteliers, management companies, owners, and other associations as a benchmarking resource and an operational aid. Hotel Horizons® is a quarterly econometric hotel forecasting publication that projects five years of supply, demand, occupancy, ADR, and RevPAR for 55 lodging markets in the U.S. A variety of economic, demographic, and other benchmarking statistics are also presented for more accurate forecasting, and allowing a deeper understanding of market conditions for the reader.
The Greater Boston Lodging Market
The city of Boston features many demand generators that attract leisure, corporate, and group travel. A city with rich American history, wide array of businesses, and strong convention center programming, Boston’s lodging market is a popular destination for both transient and group travel.
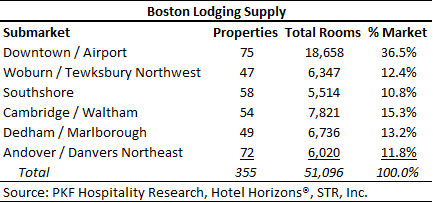
The greater Boston lodging market is relatively small by comparison to other primary U.S. markets, with approximately 51,000 hotel rooms across six submarkets: Downtown/Airport, Woburn/Tewksbury Northwest, Southshore, Cambridge/Waltham, Dedham/Marlborough, and Andover/Danvers Northeast. Below is a breakdown of each submarket.
According to PKF-HR’s Hotel Horizons® report, among the 55 U.S. markets forecasted by PKF-HR, the Boston lodging market is forecast to rank #11 in occupancy, #5 in average daily rate (ADR), and #5 in RevPAR for year-end 2014. Looking at compound average annual growth (CAAG) from 2009 to 2013, the Boston market ranked #37 in demand growth (a lower ranking due to the market’s strong occupancy levels), #9 in ADR growth, and #12 in RevPAR growth.
Greater Boston’s strong lodging performance can be attributed to its multitude of demand generators, a thriving economic base, and limited hotel development. Since 2010, Boston’s occupancy level has been greater than the national average by 10 to 11 percentage points. Boston’s CAAG ADR growth from 2009 to 2013 was 4.4 percent, ranking #9 among the Top 25 U.S. Markets, which averaged 3.4 percent for the same period.
Due to strong occupancy levels, increasing ADRs, and minimal supply increases, RevPAR for the Boston market has experienced positive performance over the past several years. In 2013, RevPAR grew by 5.5 percent, with growth weighted by ADR. ADR growth has been higher than that of occupancy growth since 2011, as the Boston lodging market began recapturing demand quickly following the end of the recession, thus allowing hotels to increase their rates faster than other markets with an established base of demand.
In 2013, lower-priced hotels experienced a slightly greater increase in RevPAR than upper-priced hotels, at 5.6 versus 5.2 percent, respectively. For three of the last four years, lower-priced hotels experienced higher RevPAR growth than upper-priced hotels. The city of Boston’s high occupancy and rates create scarcity of available rooms during peak demand periods, resulting in compression that pushes hotel guests outside the city. Lower-priced hotels, generally located in the city suburbs, are able to capture this demand overflow, followed by the ability to capture higher rates as demand has increased.
Of the six submarkets, the Andover/Danvers Northeast submarket experienced the highest percent increase in RevPAR of 7.3 percent in 2013. The Woburn/Tewksbury and Dedham/Marlborough submarkets also achieved high RevPAR growth of 6.0 and 5.9 percent, respectively.
Below is a graph depicting the 2014F RevPAR and percent change for all Boston hotels, and the 2013 RevPAR and percent change for all Boston hotels and each of the six Boston submarkets. Despite greater RevPAR increases in the suburban submarkets, the actual RevPAR levels remain far below that of the Downtown/Airport and Cambridge/Waltham.
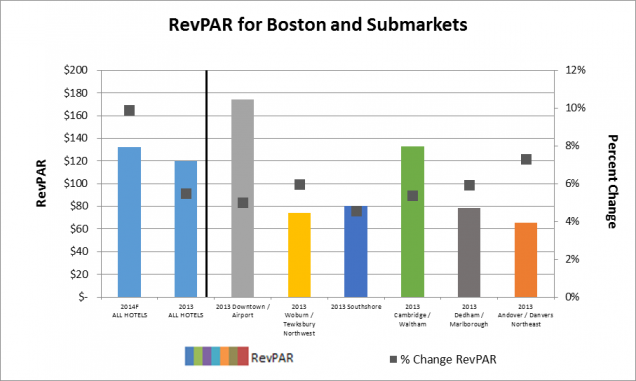
PKFC’s Boston Trends® identifies the Back Bay, Downtown, and Cambridge submarkets as the Boston Core. According to the July 2014 edition, all three submarkets experienced increases in RevPAR year-to-date of at least 7.9 percent, with an average of 9.8 percent, despite the Back Bay and Cambridge submarkets experiencing slight decreases in occupancy of 0.3 and 0.1 percent, respectively.
Route 128, Route 495 North, and Route 495 South comprise the Boston Suburbs within PKFC’s Boston Trends®. These submarkets experienced a 4.3 percent increase in occupancy YTD through July 2014 compared to the same period in 2013, while the Boston Core hotels achieved a 0.6 percent increase. This is evidence of the compression created that is benefitting the lower-priced suburban submarkets. Additionally, from the guest standpoint, most properties in the suburbs are a bargain compared to the hotel rates in the Boston Core. The YTD increase in both occupancy and rate led to an average RevPAR increase of 10.1 percent for the Boston suburbs submarket through July.
Market Segmentation
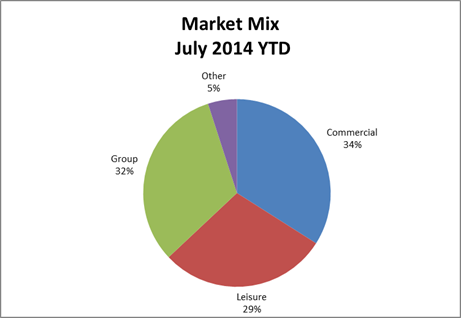
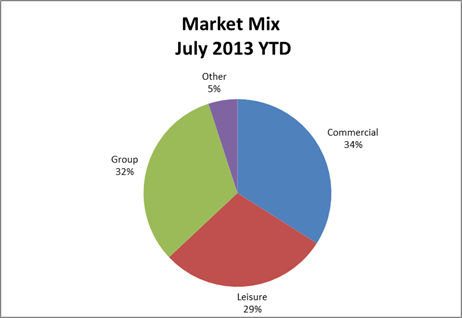
The Boston lodging market maintains a relatively stable and balanced market segmentation, demonstrated by Boston Trends® YTD July statistics. Roomnights are split almost evenly between the group (32 percent), commercial (34 percent), and leisure (29 percent) markets, which have exhibited little change in recent years.
 Source: PKF Consulting USA, LLC Boston Trends® report, July 2014
Convention Center Demand
The city of Boston is home to two convention centers, the Boston Convention and Exhibition Center (BCEC) in the Seaport District, and the John B. Hynes Veterans Memorial Convention Center (Hynes) in the Back Bay neighborhood. Unique to Boston, both convention centers were awarded gold standard certifications by the International Association of Conference Centers (IACC). The Massachusetts Convention Center Authority (MCCA) operates both the BCEC and Hynes, which have 516,000 and 193,000 square feet, respectively.
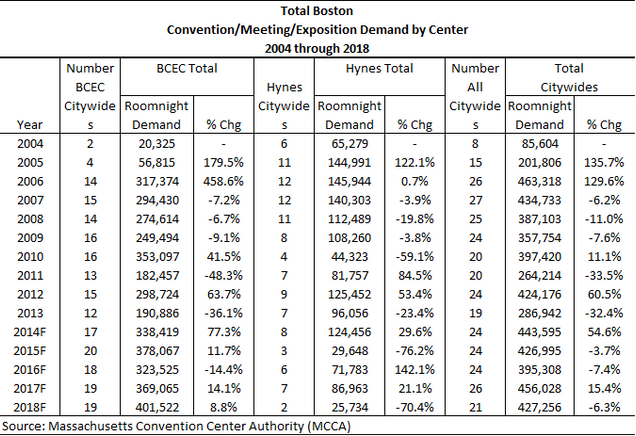
In 2013, the two convention centers captured 770,000 attendees, and generated 462,000 hotel roomnights and an estimated $620 million in economic impact. According to the MCCA’s 2014 economic impact report, the Hynes and the BCEC are expected to generate 629,000 hotel roomnights, the most since 2006, and an estimated $680 million in economic impact, the largest amount since the BCEC’s opening in 2004.
After a down-year in 2013, total citywide conventions, defined as 2,000 roomnights on peak or greater, are forecast to increase 54.6 percent in 2014. After two years of forecast slight decreases, in 2017 total citywides are expected to reach 456,000 roomnights, a 15.4 percent increase from 2016F. The following table presents the actual and projected citywide convention demand between 2004 and 2013 and projections for 2014 through 2018.
BCEC Expansion
While Boston has historically been among the nation’s top destinations for meeting and conventions, there are certain challenges that must be addressed to improve the convention center’s competitive positioning. According to a strategic development plan by Sasaki Associates, there are concerns regarding space at the BCEC and the Seaport District’s lack of a critical mass of hotel rooms, which results in excessive transportation costs for large events. The study also points to the lack of “mid-priced” hotel rooms in the greater Boston market. The expansion goal would move Boston from eighth among the top ten meeting/convention destinations in the nation to a position among the top five.
In July 2014, Governor Deval Patrick signed legislation that permits the MCCA to move forward with their BCEC expansion plan without increasing existing fees or taxes. The $1B plan calls for a 1.3MM square foot expansion that incorporates a second ballroom and additional exhibition and meeting space.
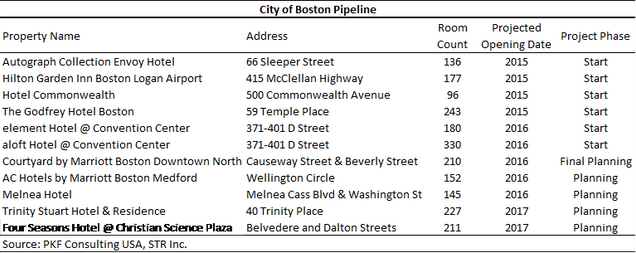
Near the BCEC, construction of an aloft and an element hotel is underway, with a combination of 510 total rooms, both scheduled to open Q1 2016. Additionally, a 1,200- to 1,500-room headquarters hotel is planned to be built cooperatively by the MCCA and Massachusetts Port Authority, across the street from the BCEC. Request for qualifications of the developers were submitted in April, and a developer is expected to be chosen by the end of this year. According to the MCCA, the BCEC expansion and the hotel developments are expected to generate $716 million annually in economic impact.
Gaming
The Boston area is expected to see new development of a hotel and casino. Wynn Resorts recently beat Mohegan Sun for the single Boston area casino license now to be located in Everett, proposing a development geared toward attracting higher-end visitors and from outside New England, to be located in Everett. These casino developments aim to be the source for the economic development and revitalization of these neighborhoods, though traffic and area housing are still items for discussion. The greater Boston casino license is estimated to generate $700M annually in gambling revenue and create a substantial number of jobs for nearby citizens.
Hotel Sales
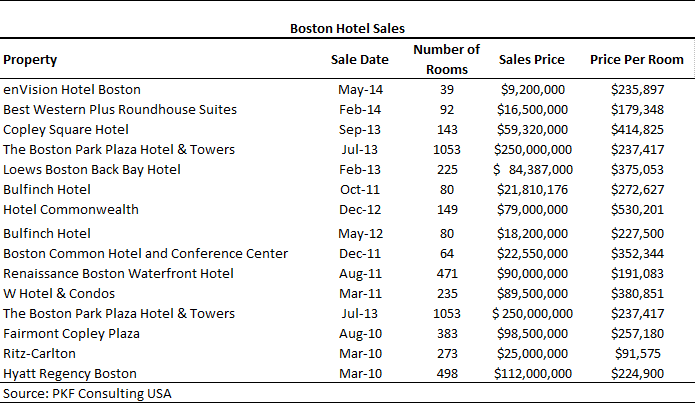
Boston has seen a healthy level of hotel transactions over the last few years. Between March 2010 and May 2014, fifteen Boston hotels sold between $91,575 and $530,201 per key. These have been predominantly full-service assets, due to the current lodging cycle in which select-service hotels are more feasible to build and full-service are often more cost-effective to buy. Hotel transactions are expected to continue into the next handful of quarters, as investors are encouraged by the strong historical and projected performance of the Boston market, remaining projected upside, availability of equity, the loosening debt market for acquisitions of existing properties, and the interest in solid assets in gateway markets like Boston. The following table presents hotels within the Boston that have transacted since March 2010.
Supply growth was limited between 2009 and 2013, with a CAAG of 0.3 percent, and is forecast to increase to a CAAG of 1.4 percent from 2014 to 2016. In 2017 and 2018, supply growth is expected to increase to 2.7 and 3.1 percent, respectively. The long-run average annual increase in supply for the Boston market is 1.9 percent.
Projected Performance
The Boston lodging market is expected to continue to perform strongly relative to the rest of the nation. On average, Boston hotels are forecast to see a 9.9 percent increase in RevPAR in 2013, greater than the 5.5 percent increase in RevPAR in 2013. Occupancy is projected to increase through 2015 achieving record high levels, before adjusting to a more stabilized level as new supply is absorbed. RevPAR is forecast to increase by a 5.8 percent CAAG through 2018, driven predominantly by increases in ADR.
For year-end 2014, lower-priced hotels are forecast to achieve higher RevPAR growth than upper-priced hotels, at 11.3 percent compared to 9.5 percent. The delta is attributed to the greater opportunity for occupancy growth in the lower-priced hotels, compared to the upper-priced hotels, as demand further strengthens and compression ensues. In 2015 and 2016, we anticipate the trend to reverse, as lower-priced hotel occupancy reaches its peak and RevPAR increases are focused primarily on ADR for all segments.
The greater Boston lodging market has flourished in the recent past. For 2014, hotel occupancies are expected to finish at the highest levels they have been in several years. Average daily rate growth has experienced positive growth since 2010 and ADR is projected to surpass $200 by 2016 for upper- and lower-priced hotels combined. This positive growth in both demand and ADR is expected to continue and lead to an increase in supply in the years to come. ■
About the data
Performance and forecast data used in this article are sourced from PKFC’s Boston Trends in the Hotel Industry® and PKF-HR’s Hotel Horizons® September-November 2014 Edition. Boston Trends® compiles performance data from approximately 100 hotels in the Greater Boston area, published in a monthly report used by hoteliers, management companies, owners, and other associations as a benchmarking resource and an operational aid. Hotel Horizons® is a quarterly econometric hotel forecasting publication that projects five years of supply, demand, occupancy, ADR, and RevPAR for 55 lodging markets in the U.S.
14 comments
I totally like your gave limits as the post you passed on has some uncommon information which is totally essential for me. MyFloridaAccess
Thanks for this wonderful information. Mysainsburys Portal
Canadian people have a great opportunity to get a $1000 Optimum Pc Gift Card from Loblaws Retail Store. To get a Gift Card, you must participate in the Store Opinion Ca Survey at https://storeopinion-can.com/. Your previous purchase receipt helps you to finish the survey quickly.
People who are struggling in their life, your article will be proven helpful for them. They must read this article.
Love Spell for Vedic Astrologers
This is a very interesting article. Please, share more like this!
Private Limited Company Registration
Thank you. I read this interesting and useful page carefully and I learned a lot from it.Thankful
inter caste marriage solution
Thanks for sharing this great information, i would appreciate if you share this type of information regularly.
Tempo Traveller Rental in Jaipur
This is a very interesting article. Please, share more like this!
Tempo Traveller In Jaipur
I expect we will get this type of informative article more and more.
Vastu Shastra
I expect we will get this type of informative article more .
Vastu Shastra
we will get this type of informative article more .
Vastu Shastra
The greater Boston lodging market is relatively small by comparison to other primary U.S. markets, with approximately 51,000 hotel rooms across six submarkets: Downtown/Airport, Woburn/Tewksbury Northwest, Southshore, Cambridge/Waltham, Dedham/Marlborough, and Andover/Danvers Northeast, this is awesome data you have shared, hopefully these figure will grow in upcoming years. Medical Billing Services in Charlotte, NC
Good And Informative Blog.
Tempo Traveller In Japur
This is a very interesting article.
Luxury Tempo Traveller Rental Rajasthan