Bruce T. Anderson, Department of Geography and Environment, Boston University
Renellys Perez, University of Miami/Cooperative Institute of Marine and Atmospheric Studies, NOAA
Katia Oleinik, Scientific Computing and Visualization, Boston University
Introduction
The El Niño/Southern Oscillation (ENSO)—which represents a coupled mode of ocean/atmosphere variability in the equatorial Pacific—imposes wide-spread changes to regional climates, with significant physical, biological, and socio-economic impacts in both hemispheres of the globe. Evidence from high-resolution observationally-constrained ocean data suggest that warm ENSO events (El Niños) can be initiated by modifications to the sub-surface equatorial Pacific Ocean temperatures in response to a weakening of central Pacific trade winds induced by northern hemisphere sea-level pressure variations. The research involves identifying modes of subtropical and extratropical ocean/atmosphere variability that have significant influences upon the El Niño/Southern Oscillation (ENSO) system. As part of this the research group has analyzed the dynamics of intraseasonal to interannual atmospheric variations that initiate ENSO events, as well as the dynamics of the surface and subsurface oceanic responses.
See more details on Dr. Anderson’s work at http://people.bu.edu/brucea/large-scaleocean.html.
RCS Contribution
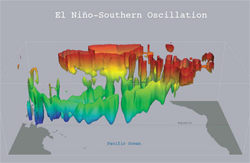
RCS staff member Katia Oleinik created a 3D Visualization that helped the researchers explore the change of water temperatures over time and under various conditions simulated during the experiment. The final set of animations was a result of a multi-step process. The first step included filtering, smoothing and interpolation of raw data that was in the netCDF format. The data was then mapped to 3D space and used for construction of iso-surfaces. Additional annotations were added to the volume. A few different color-schemes were discussed with the researcher to highlight important features and regions of interest. Different parameters for the final set of animations were tested to ensure the highest quality for the final movie.
More Information
We have a longer writeup on this work, including the video sequence described above, in our Visualizations Gallery.
If you are interested in our visualization consulting services, please contact us.