Gordana Garapic and Ulrich Faul – Department of Earth Sciences, Boston University
Erik Brisson – Scientific Computing and Visualization, Boston University
Melting and melt segregation are key processes in the evolution of the Earth. Melting occurs in specific environments in the Earth’s upper mantle such as subduction zones, mid-ocean ridges and continental rift zones. The presence of melt affects the physical properties of rocks. An important example is the effect on seismic properties; melt reduces seismic wave velocities. Melt also affects rock deformation behavior by making rocks weaker.

The effects of melt, if it is present in small amounts, depend principally on its distribution among crystalline grains. It will have little effect in disconnected form, but interconnected layers will greatly impact those properties. Melting starts at the junctions of grains of different composition. Due to the continuous process of rearrangement of neighboring grains due to their growth or shrinkage, melt tends to form complex shapes among the grains.
The currently accepted model predicts that melt forms a simple interconnected network along three-grain edges and starts to segregate from the host rock as soon as it forms, driven by density differences. To study the effects of melt on physical properties as well as melt segregation, particularly for small porosities, it is necessary to determine the 3-D melt geometry. Existing models of grain scale melt distribution are deduced from observations of 2-D polished surfaces. However, it is impossible to resolve the complex 3-D geometry of melt by this method.

To overcome this problem, we conduct serial sectioning and successive high resolution scanning electron imaging (FE-SEM, Zeiss Supra, 40 VP, hosted at the Photonics Center of Boston University) of partially molten rock samples (33 micron mean grain size). The sample used in this study was produced in a piston cylinder at 1350°C and 1 GPa, where it was annealed for 432 hours. Consecutive 2-D layers, approximately 300×230 microns in size and 1.5 micron apart, were obtained as a basis for building a 3-D computer model of the melt.
Melt regions were identified within each slice. Taken as a stack, the slices were registered and surface reconstruction techniques were applied to give a 3-D representation of the melt boundaries. This provides a physical system which will be used for modeling of porous melt flow. Renderings of the 3-D melt geometry show that in addition to a network of tubules at three-grain edges, melt forms thin sheets on two-grain boundaries. This finding contradicts the existing model in which melt resides only in tubules along three-grain edges.

Visualization Sequence
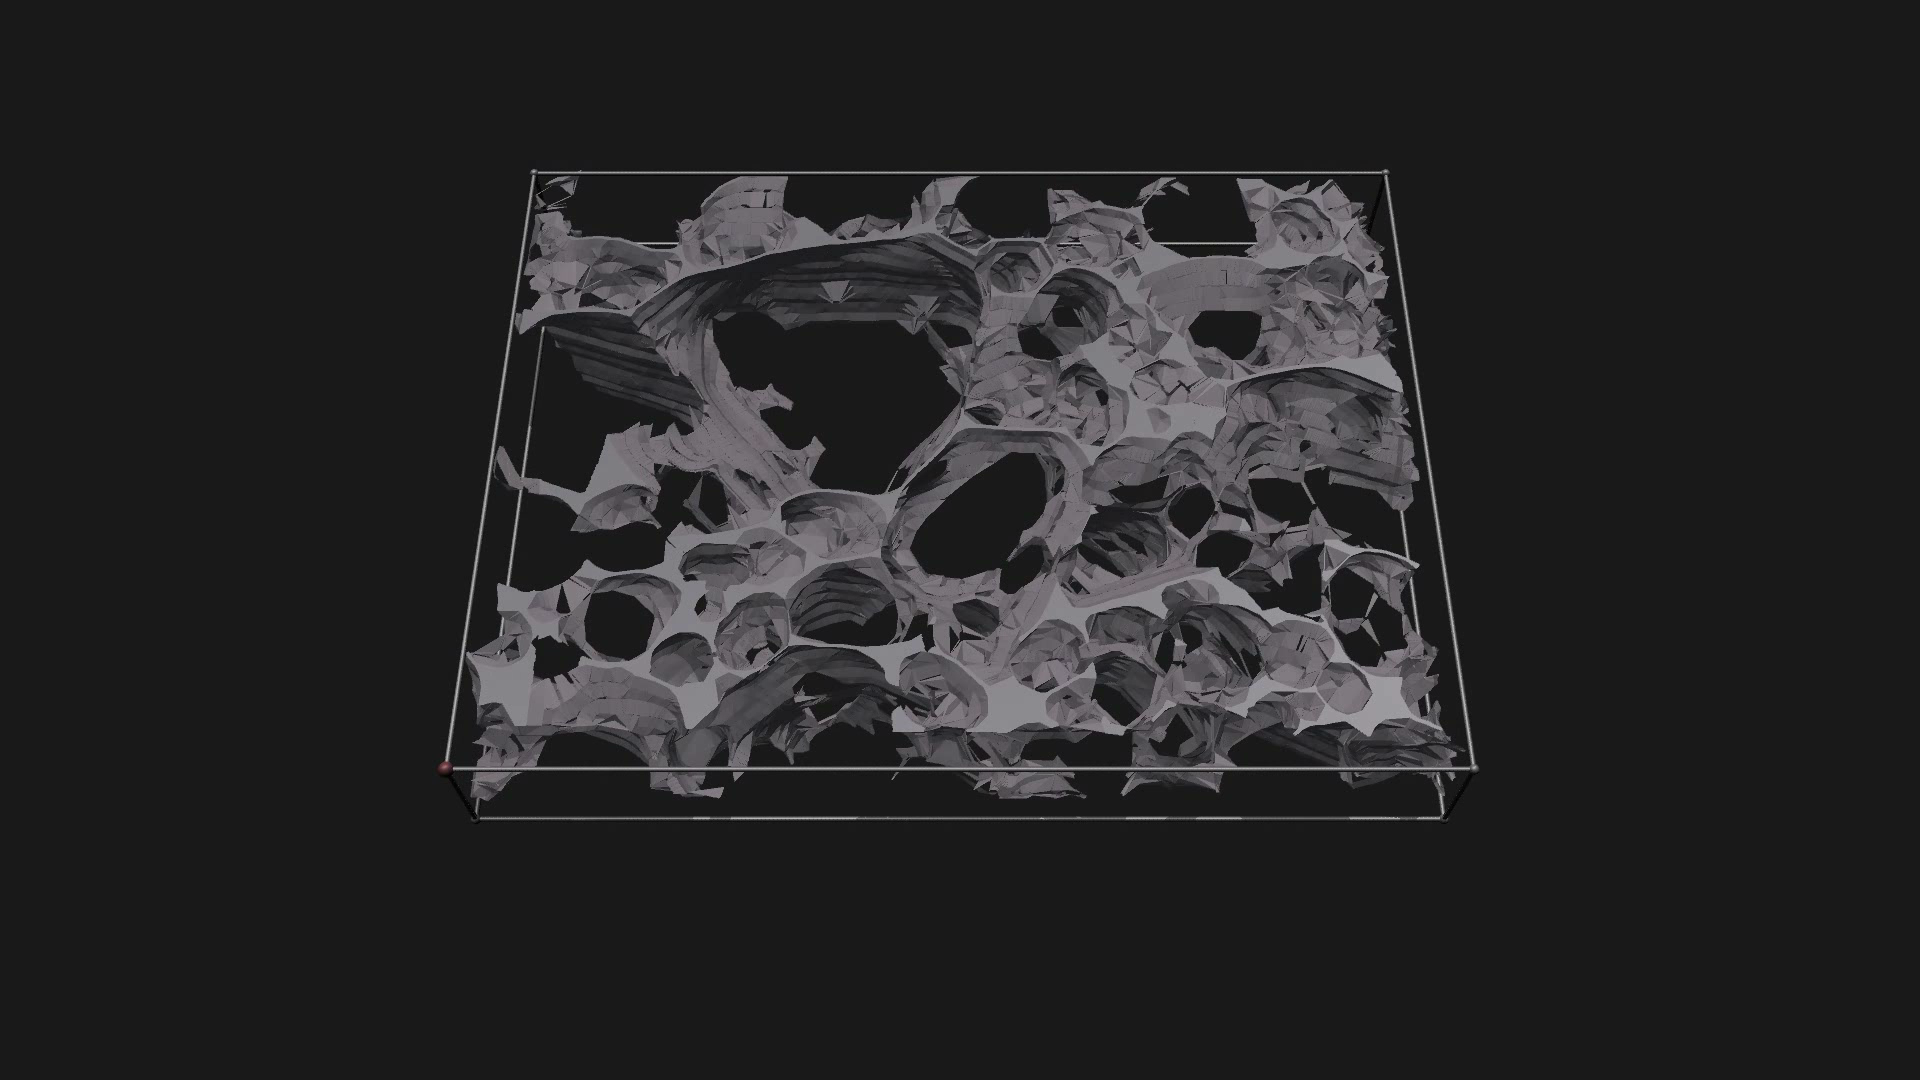
Melting and melt segregation are key processes in the evolution of the Earth. Using serial sectioning and successive high resolution scanning electron imaging of partially molten rock samples, consecutive 2-D layers (approximately 300×230 microns in size and 1.5 micron apart) were obtained as a basis for building a 3-D computer model of melt. Renderings of the 3-D melt geometry show that in addition to a network of tubules at three-grain edges, melt forms thin sheets on twograin boundaries.