Xiaoyuan Yang1, Alan Strahler1, and Erik Brisson2
1. Department of Geography and Environment, Boston University
2. Scientific Computing and Visualization Group, Boston University
Introduction
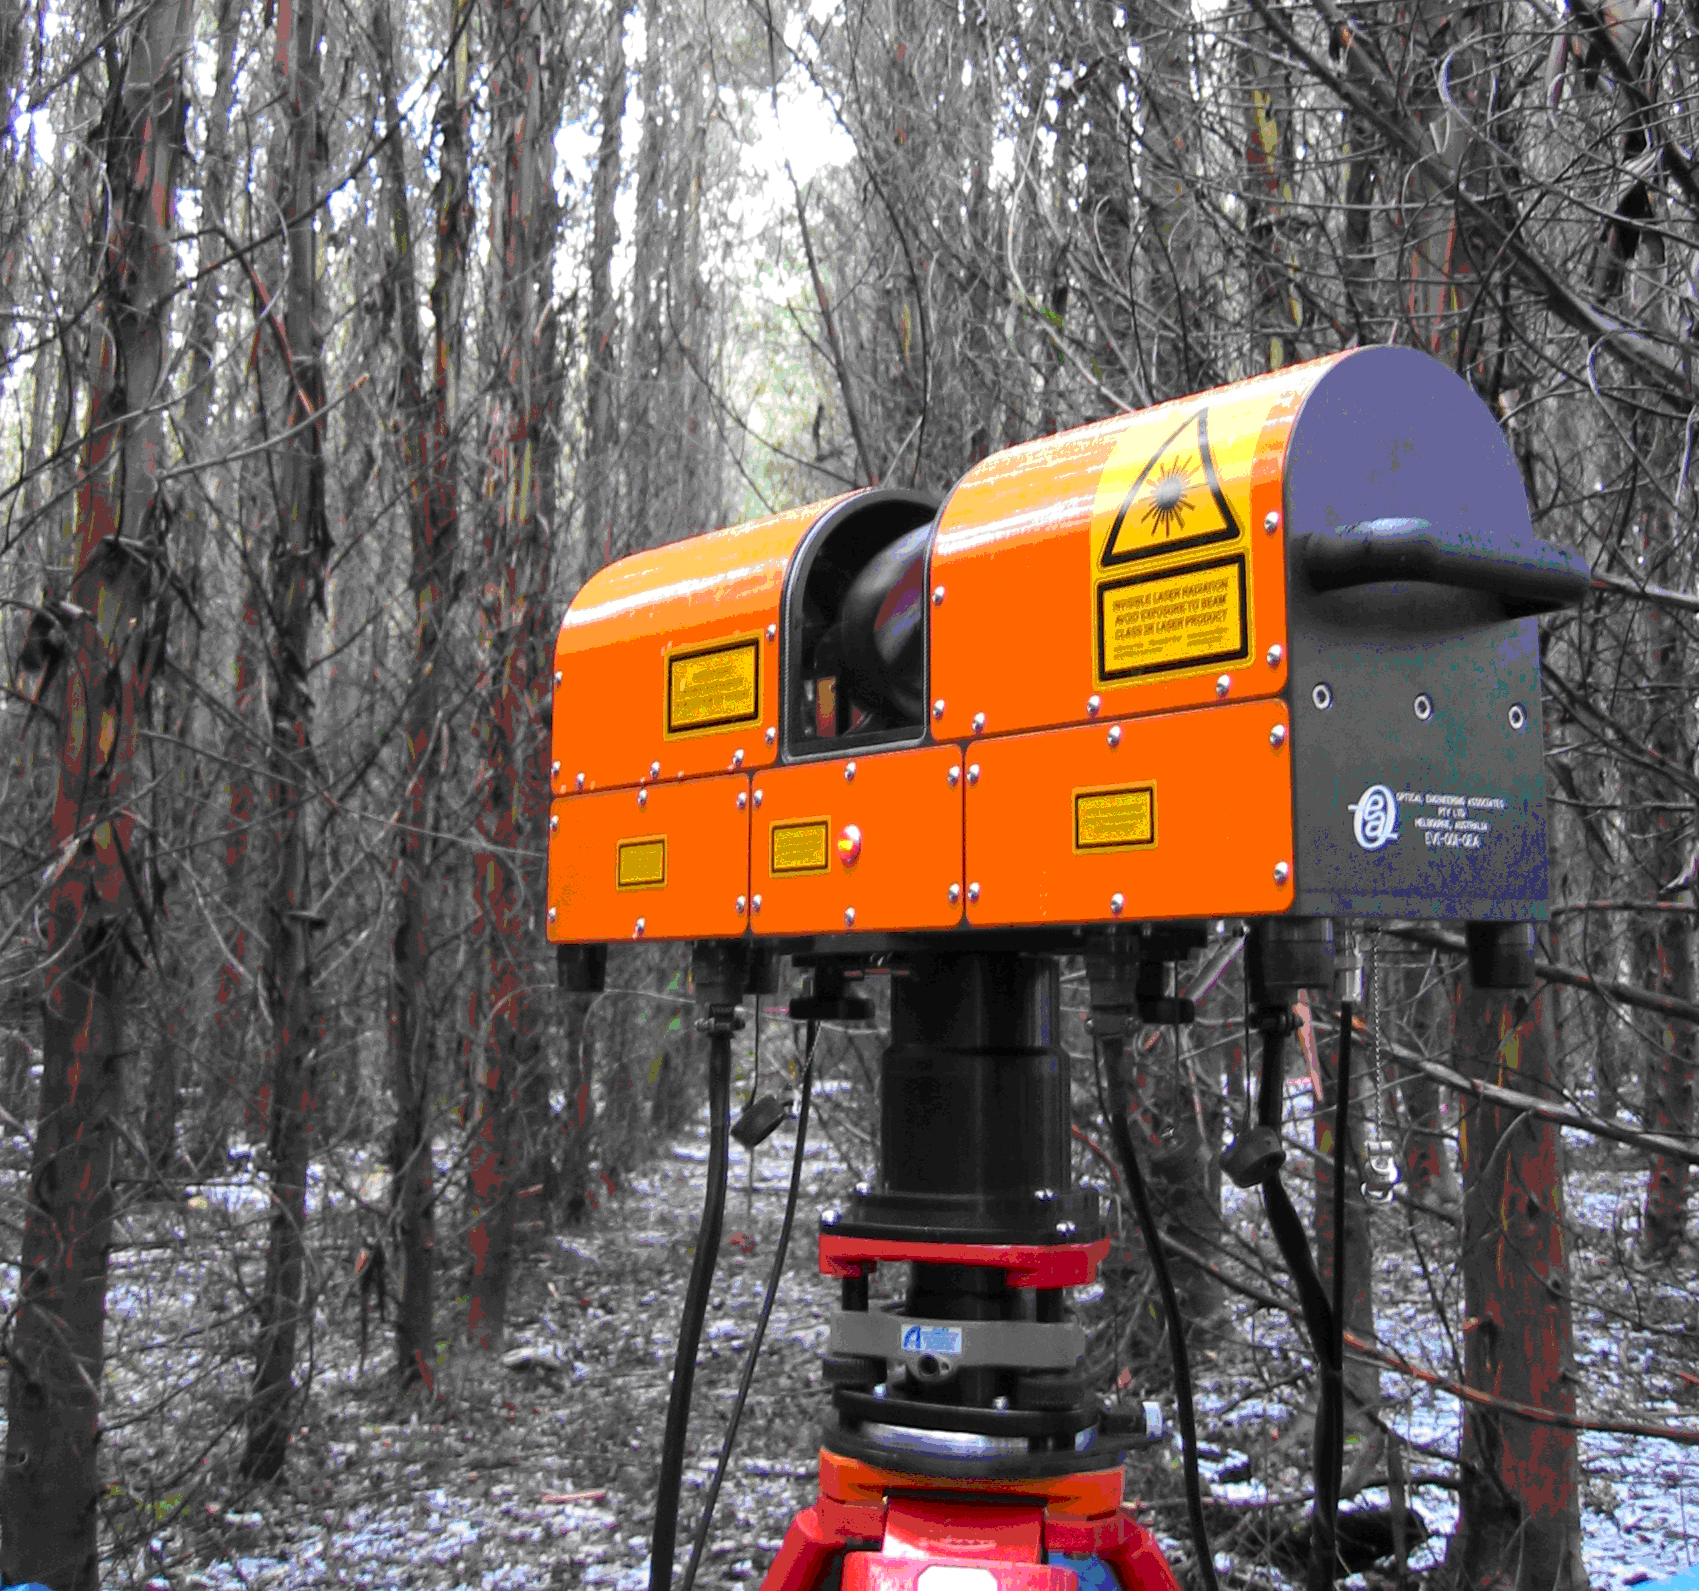
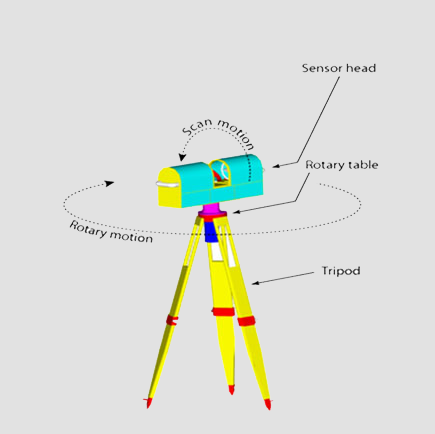
The prototype Echidna® validation instrument (EVI), built by CSIRO Australia, is an upward-scanning, under-canopy near-infrared lidar. The EVI uses a hemispherical-scanning, diode-pumped solid-state 1064 nm Nd:YAG laser. A photodiode digitizes the energy reflected from objects along the path of each laser pulse to provide a “waveform,” depicting the intensity of reflected laser energy as a function of time and therefore distance. A single hemispherical EVI scan can capture tree stem size and location information from horizontal (cross-sectional) views, tree height and canopy structure from near-vertical views, and stem form, taper, and branching structure from intermediate scan angles.
Data Acquisition
We acquired Echidna® under-canopy hemispherical lidar scans at a site dominated by red fir, white fir, and several large sequoias in the Sierra National Forest, California, as part of a NASA-supported research grant to test the ability of the instrument to retrieve forest structure by remote measurement. Five EVI scans were acquired at the center and near the four corners of a 33.3 meter by 33.3 meter square, with the relative locations of scans recorded by compass azimuth and taped distance.


The Point Cloud Volume
The peak intensity and its location within each waveform were used to fill a three-dimensional, gridded volume in rectangular coordinate space to form a point cloud dataset for each of the five lidar scans. Considering that some leaves or branches are always hidden by others in a single scan, and that local terrain effects can also obscure parts of the forest within a scan, we registered the overlapping portion of the point clouds from the five scans. The combined point cloud data set then reconstructs the forest as a three-dimensional point cloud within a central volume.

Material Classification
Tagging the points with information extracted from the full waveform data, such as the intensity and width of each peak, provides the ability to identify and separate large solid volumes, such as trunks and branches, from finer, more diffuse volumes, such as leaves.


Surface Reconstruction
We are also developing shape extraction software to further analyze the point cloud dataset, to build a three-dimensional “tree object” reconstruction, providing directly-quantified estimates of important forestry canopy parameters such as woody biomass, foliage area volume, and structural measurements of tree diameter and height. Moreover, the size, shape, and location of leaf volumes can be used to measure and model within- and between-crown clumping and gap structure. This work can also be utilized to calibrate broad-scale airborne lidar data and thus provide structural mapping over larger geographic areas for environmental assessment such as carbon balance modeling.


Acknowledgments
This research is supported by NASA grant NNG-0GG192G.