Comparing apples and oranges? Examining the impacts of Airbnb on hotel performance in Boston

By Tarik Dogru, Makarand Mody, and Courtney Suess
If you are in the hotel industry, chances are that Airbnb has come up in conversation at some point or another. The sharing economy phenomenon and the economic, social, and technological changes fueling its growth have challenged the hotel industry to rethink its experiential value proposition to the customer (Mody, Suess, & Lehto, in press). Airbnb founder and CEO Brian Chesky tweeted that “Airbnb hosted more than 2 million guests in the past New Year’s Eve,” and that with the last round of financing, which was $1 billion, Airbnb is now valued at $31 billion (Yurieff, 2017). As a result, Airbnb has been at the core of discussions in the world of hospitality and beyond, mainly due to its potential and uncalculated impacts. On one hand, Airbnb might have positive economic impacts on hospitality and tourism institutions, such as restaurants, bars, and other area attractions, through increases in income and job creations. On the other hand, potential adverse economic impacts of Airbnb cannot be overlooked: Airbnb might negatively affect the hotel industry, if visitors were to shift their demand from hotels to Airbnb accommodations. However, it is not yet clear whether Airbnb is taking a share of the existing hotel industry pie or increasing the size of the overall accommodations industry.

The results from the most comprehensive study analyzing the effects of Airbnb on the hotel industry showed that a 1% increase in Airbnb listings decreases hotel revenue by 0.05% (Zervas, Proserpio, & Byers, 2016). Thus, although negative effects on hotel revenues by way of Airbnb were reported in this study, the magnitude of these effects was small in the given location of Texas. On the other hand, a study conducted in Korea showed that Airbnb does not affect hotel revenues at all (Choi, Jung, Ryu, Do Kim, & Yoon, 2015). A recent study conducted by Smith Travel Research (STR) in 13 global markets reported that Airbnb listings did not affect hotel demand and revenues (Haywood, Mayock, Freitag, Owoo, & Fiorilla, 2017).
While there are limited studies from which to draw definitive conclusions on the effects of Airbnb on the hotel industry, according to Mr. Chesky, Airbnb does not directly compete with the hotel industry. He claims that Airbnb guests are not typical hotel customers, but rather those who would have stayed with friends and family (Intelligence, 2017). Although Airbnb argues that it brings new visitors to destinations and that 70% of its listings are outside of hotel districts, a report by Morgan Stanley indicates that about 42% and 36% of Airbnb guests switched from hotels and bed and breakfasts respectively, whereas only 31% of Airbnb guests represent those who would have stayed with friends and family (Intelligence, 2017). Furthermore, a recent study conducted in Los Angeles showed that more than 60% of the properties listed on Airbnb are solely used for commercial purposes and thus are excluded from the residential real estate market (Lee, 2016). According to a recent report by CBRE, revenue generated by hosts renting out two or more units was about $1.8 billion, and hosts renting out ten or more units generated $175 million in 13 major US markets in 2016 (CBRE, 2017). Despite this massive amount of generated revenue, the hosts are generally not paying taxes on their properties.
While there seems to be free-riders on the market that take advantage of the sharing economy platforms like Airbnb by listing multiple properties, based on the current knowledge, it is still not clear whether Airbnb has an adverse effect on the hotel industry. The present study compares the hotel industry and Airbnb in terms of key performance metrics, including occupancy, ADR, and RevPAR, to determine whether and how Airbnb affects the hotel industry in Boston. Boston is a strong hotel market, but italso has a considerable and growing Airbnb supply, so it provides an excellent context for our analysis.
In our analyses, we treated Airbnb as an accommodation firm to analyze whether it is directly competing with hotels in Boston. Accordingly, the number of Airbnb units listed and the number of units rented (including entire homes and private and shared rooms) multiplied by the number of days in a specified time period constitute Airbnb supply and demand figures, respectively. Occupancy, ADR, and RevPAR were calculated following the same methodology used to calculate these statistics in hotel industry. The Airbnb and hotel data were provided by Airdna and STR, respectively. We analyzed data for the period between January 2015 and September 2016.
ANALYSIS
Comparing changes in supply and demand
Tables 1 and 2 present the supply, demand, and revenue statistics for Airbnb and hotels in the city of Boston during the analysis period.
Table 1. Airbnb Supply and Demand
| Period | Airbnb Supply | % Change in Supply | Airbnb Demand | % Change in Demand |
| Jan-15 | 79,110 | N/A | 575 | N/A |
| Feb-15 | 85,890 | 8.6 | 4,506 | 683.7 |
| Mar-15 | 91,710 | 6.8 | 7,811 | 73.3 |
| Apr-15 | 106,380 | 16.0 | 18,733 | 139.8 |
| May-15 | 114,330 | 7.5 | 30,547 | 63.1 |
| Jun-15 | 123,180 | 7.7 | 38,545 | 26.2 |
| Jul-15 | 122,670 | -0.4 | 51,378 | 33.3 |
| Aug-15 | 119,580 | -2.5 | 37,555 | -26.9 |
| Sep-15 | 128,730 | 7.7 | 51,757 | 37.8 |
| Oct-15 | 142,470 | 10.7 | 41,011 | -20.8 |
| Nov-15 | 363,660 | 155.3 | 76,451 | 86.4 |
| Dec-15 | 383,880 | 5.6 | 65,064 | -14.9 |
| Jan-16 | 380,910 | -0.8 | 73,300 | 12.7 |
| Feb-16 | 375,480 | -1.4 | 101,409 | 38.3 |
| Mar-16 | 372,540 | -0.8 | 112,501 | 10.9 |
| Apr-16 | 373,050 | 0.1 | 134,951 | 20.0 |
| May-16 | 374,970 | 0.5 | 137,347 | 1.8 |
| Jun-16 | 378,870 | 1.0 | 147,947 | 7.7 |
| Jul-16 | 385,260 | 1.7 | 148,473 | 0.4 |
| Aug-16 | 385,620 | 0.1 | 123,588 | -16.8 |
| Sep-16 | 390,270 | 1.2 | 107,690 | -12.9 |
Table 2. Hotel Supply and Demand
| Period | Hotel Supply | % Change in Supply | Hotel Demand | % Change in Demand |
| Jan-15 | 1,588,843 | N/A | 896,065 | N/A |
| Feb-15 | 1,436,512 | -9.6 | 901,459 | 0.6 |
| Mar-15 | 1,598,701 | 11.3 | 1,200,426 | 33.2 |
| Apr-15 | 1,550,910 | -3.0 | 1,216,283 | 1.3 |
| May-15 | 1,605,304 | 3.5 | 1,328,932 | 9.3 |
| Jun-15 | 1,558,800 | -2.9 | 1,357,872 | 2.2 |
| Jul-15 | 1,610,760 | 3.3 | 1,413,521 | 4.1 |
| Aug-15 | 1,616,278 | 0.3 | 1,393,622 | -1.4 |
| Sep-15 | 1,564,170 | -3.2 | 1,335,976 | -4.1 |
| Oct-15 | 1,616,340 | 3.3 | 1,394,364 | 4.4 |
| Nov-15 | 1,564,170 | -3.2 | 1,105,292 | -20.7 |
| Dec-15 | 1,616,309 | 3.3 | 906,619 | -18.0 |
| Jan-16 | 1,632,367 | 1.0 | 909,132 | 0.3 |
| Feb-16 | 1,482,796 | -9.2 | 895,546 | -1.5 |
| Mar-16 | 1,646,410 | 11.0 | 1,150,937 | 28.5 |
| Apr-16 | 1,593,300 | -3.2 | 1,273,368 | 10.6 |
| May-16 | 1,650,409 | 3.6 | 1,303,974 | 2.4 |
| Jun-16 | 1,603,050 | -2.9 | 1,366,553 | 4.8 |
| Jul-16 | 1,656,392 | 3.3 | 1,406,893 | 3.0 |
| Aug-16 | 1,667,955 | 0.7 | 1,403,774 | -0.2 |
| Sep-16 | 1,622,130 | -2.7 | 1,347,565 | -4.0 |
The number of Airbnb listings has increased dramatically from 79,110 in January 2015 to 390,270 in September 2016. While the highest growth in hotel room supply was about 11% month-over-month (in March 2016), Airbnb supply experienced a phenomenal growth rate of 155% (in November 2015). Extraordinary changes in hotel room supply might be due to renovations and the completions of ongoing projects in the pipeline. However, the extreme supply shocks in the case of Airbnb are due to the greater flexibility of adding or removing existing residential properties in the market.
Changes in demand were greater than the changes in supply for both Airbnb and the hotel industry. Yet overall trends indicate that Airbnb experienced greater increases in demand as compared to the increases in the demand for hotel rooms. For example, Airbnb demand increased by 684%, 140%, and 33% in February, April, and July 2015 respectively, whereas hotel demand only increased by 0.6%, 1.3%, and 4.1% during these months. Although the changes in demand for Airbnb and the hotel industry during the analysis period were, for most part, in the same direction (albeit to varying degrees), there were some anomalies where the changes occurred in the opposite direction. For example, in September and November 2015, while hotel demand decreased by around 4% and 21% respectively, the demand for Airbnb accommodations increased by about 38% and 86% respectively. Also, demand for Airbnb accommodations decreased by 21% in October 2015, whereas hotel demand increased by 4% during the same period.
Comparing Occupancy, ADR, and RevPAR
Tables 3 and 4 shows occupancy, ADR, and RevPAR statistics for Airbnb and hotels in the city of Boston during the analysis period.
Table 3. Airbnb OCC-ADR-RevPAR
| Period | Airbnb Occupancy | Airbnb
ADR |
Airbnb RevPAR |
| Jan-15 | 0.70 | $158.86 | $1.15 |
| Feb-15 | 5.20 | $133.05 | $6.98 |
| Mar-15 | 8.50 | $153.44 | $13.07 |
| Apr-15 | 17.6 | $161.00 | $28.35 |
| May-15 | 26.7 | $134.61 | $35.97 |
| Jun-15 | 31.3 | $186.51 | $58.36 |
| Jul-15 | 41.9 | $180.12 | $75.44 |
| Aug-15 | 31.4 | $142.24 | $44.67 |
| Sep-15 | 40.2 | $183.34 | $73.71 |
| Oct-15 | 28.8 | $171.78 | $49.45 |
| Nov-15 | 21.0 | $151.97 | $31.95 |
| Dec-15 | 16.9 | $149.88 | $25.40 |
| Jan-16 | 19.2 | $142.60 | $27.44 |
| Feb-16 | 27.0 | $160.89 | $43.45 |
| Mar-16 | 30.2 | $156.35 | $47.22 |
| Apr-16 | 36.2 | $158.33 | $57.27 |
| May-16 | 36.6 | $160.96 | $58.96 |
| Jun-16 | 39.0 | $187.26 | $73.13 |
| Jul-16 | 38.5 | $176.45 | $68.00 |
| Aug-16 | 32.0 | $145.23 | $46.55 |
| Sep-16 | 27.6 | $159.41 | $43.99 |
Table 4. Hotel OCC-ADR-RevPAR
| Period | Hotel Occupancy | Hotel
ADR |
Hotel RevPAR |
| Jan-15 | 56.4 | $142.74 | $80.50 |
| Feb-15 | 62.8 | $144.29 | $90.55 |
| Mar-15 | 75.1 | $170.58 | $128.08 |
| Apr-15 | 78.4 | $188.01 | $147.44 |
| May-15 | 82.8 | $205.62 | $170.22 |
| Jun-15 | 87.1 | $206.68 | $180.04 |
| Jul-15 | 87.8 | $200.44 | $175.90 |
| Aug-15 | 86.2 | $193.64 | $166.96 |
| Sep-15 | 85.4 | $209.00 | $178.51 |
| Oct-15 | 86.3 | $220.10 | $189.87 |
| Nov-15 | 70.7 | $183.17 | $129.43 |
| Dec-15 | 56.1 | $147.97 | $83.00 |
| Jan-16 | 55.7 | $146.43 | $81.55 |
| Feb-16 | 60.4 | $146.65 | $88.57 |
| Mar-16 | 69.9 | $171.94 | $120.20 |
| Apr-16 | 79.9 | $201.51 | $161.04 |
| May-16 | 79.0 | $207.29 | $163.78 |
| Jun-16 | 85.2 | $212.35 | $181.02 |
| Jul-16 | 84.9 | $199.52 | $169.47 |
| Aug-16 | 84.2 | $198.45 | $167.02 |
| Sep-16 | 83.1 | $219.26 | $182.15 |
Hotel occupancy rates decreased to 83% in September 2016 from 85% in the same period of the previous year, whereas Airbnb’s occupancy has seen a greater decrease from 40% to 28% in the same period. In February 2015, Airbnb’s occupancy was around 5% and reached about 28% in September 2016. While Airbnb experienced a dramatic increase in occupancy growth throughout the analysis period, these gains did not seem to affect the hotel industry’s occupancy rates.
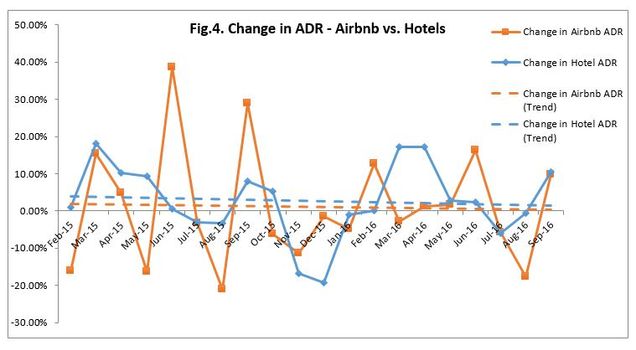
Although hotel ADR was generally greater than that of Airbnb, Airbnb’s ADR figures were greater than hotel ADR in three months (January 2015, December 2015, and February 2016). Hotel ADR was $209 in September 2015 and increased to about $219 in September 2016. Despite the lower occupancy in hotels in September 2016 as compared to the same time in the previous year (September 2015), the RevPAR was comparatively higher even after correcting for inflation. (Note: The RevPAR increased from $75.17 to $75.58 based on 1982=100 prices.) A clear trend can be observed in hotel ADR and RevPAR figures through 2015, and this trend seemed to persist in 2016 in terms of the month-over-month growth rates. However, Airbnb ADR and RevPAR seemed to fluctuate throughout 2015 and do not seem to follow a seasonal movement. Indeed, supply and demand dynamics may have caused the changes in Airbnb ADR and RevPAR, where the equilibrium price is set within the Airbnb market. However, the lack of revenue management practices by Airbnb hosts might also have contributed to these fluctuations in ADR and RevPAR.


Hotel performance before and after the arrival of Airbnb
We further analyzed the hotel industry trends for Boston during last 12 years (presented in Table 5), both before and after Airbnb’s entry into the market, to determine whether Airbnb has an effect on hotel supply, demand, and revenue dynamics. The hotel room supply has continued to grow, which suggests that hotel industry seem to continue to grow despite the rise of the Airbnb. The hotel industry’s occupancy saw its lowest point in 2009 and reached over 85% in 2015. Although hotel occupancy experienced a few declines year over year, these decreases appear to be due to supply shocks. For example, in 2016, occupancy decreased by about 2.7%; however, supply growth was around 3.7%. That is, the decline cannot be entirely attributed to the growth in Airbnb. Despite the declines in occupancy, both ADR and RevPAR have continued to increase without a decline after the crisis period and around the arrival of Airbnb onto the scene (2008-2009), and reached their peak in September 2016.
Table 5. Historical Hotel Dynamics
| Period | Supply | Demand | Occupancy | ADR | RevPAR |
| Sep-05 | 1418370 | 1092599 | 77.0 | $143.85 | $110.81 |
| Sep-06 | 1460070 | 1095808 | 75.1 | $152.20 | $114.23 |
| Sep-07 | 1472790 | 1164487 | 79.1 | $165.97 | $131.23 |
| Sep-08 | 1492830 | 1105819 | 74.1 | $171.52 | $127.06 |
| Sep-09 | 1504560 | 1091371 | 72.5 | $143.20 | $103.88 |
| Sep-10 | 1512540 | 1176147 | 77.8 | $155.26 | $120.73 |
| Sep-11 | 1512810 | 1225707 | 81.0 | $162.31 | $131.51 |
| Sep-12 | 1528290 | 1208011 | 79.0 | $170.08 | $134.43 |
| Sep-13 | 1538100 | 1251193 | 81.3 | $180.20 | $146.58 |
| Sep-14 | 1537860 | 1306622 | 85.0 | $202.38 | $171.95 |
| Sep-15 | 1564170 | 1335976 | 85.4 | $209.00 | $178.51 |
| Sep-16 | 1622130 | 1347565 | 83.1 | $219.26 | $182.15 |
So, has Airbnb impacted hotel performance in Boston? The data suggests “no”!
Hotels were able to sell more rooms over the last 12 years—that is, more people stayed in hotels in 2016 compared to previous years, despite the demand that was captured by Airbnb. Although it is not clear whether the excess demand in the overall accommodations market was created solely because of Airbnb, the additional demand, at least to some extent, could have been accommodated by hotels in Boston. Hotels in the city have, on average, around 83% occupancy. Thus, for example, if the Airbnb guests were to be captured by the hotels in Boston, the average hotel occupancy would have been around 90% in September 2016. However, considering the fact that Airbnb’s ADR was lower than that of hotels ($159 vs. $219), hotels would probably have captured the Airbnb demand within this lower Airbnb price range. It should also be noted that, historically, the hotel occupancy in the Boston market has fluctuated between 74 and 85%. With this in mind, Airbnb does not seem to whip from the hotel industry’s market share, but rather seems to have created new demand. Although correlation does not indicate causation, the correlation coefficients between hotel and Airbnb supply, demand, revenue, occupancy, ADR, and RevPAR (presented in Table 6) also suggest that Airbnb does not seem to adversely affect the hotel industry in Boston.
Table 6. Correlations
| Hotel Supply | Hotel Demand | Hotel Occupancy | Hotel ADR | Hotel RevPAR | |
| Airbnb Supply | 0.386 | ||||
| Airbnb Demand | 0.289 | ||||
| Airbnb Occupancy | 0.716 | ||||
| Airbnb ADR | 0.494 | ||||
| Airbnb RevPAR | 0.358 |
Nevertheless, as Table 7 indicates, Airbnb has been able to increase its market share quite remarkably. In particular, Airbnb’s market share in terms of supply has increased from about 5% in January 2015 to about 19% of the overall accommodation market (i.e., available room nights) in September 2016. Theoretically, the Airbnb supply can be as large as the residential real estate market in a location. However, it takes a few years to develop a hotel and thus boost the hotel room supply in the market, so comparing the market share in terms of supply is less than ideal. Airbnb’s market share in terms of demand also shows significant growth, from less than 0.1% in January 2015 to more than 7% in September 2016. Despite Airbnb’s penetration into the market in terms of supply and demand, Airbnb’s market share in terms of revenues was only around 5.5% in September 2016. The lower market share in revenues is likely due to lower prices compared to those of hotels and the lack of revenue management practices by the Airbnb hosts. While a 5.5% market share in terms of revenue is considerable for a start-up like Airbnb, it should be highlighted that Airbnb seems to have created new demand by increasing the market size. We estimated approximately $15 million in tax obligations based on the revenues generated by Airbnb during 2015-2016, which is similar to the figures found in the recent CBRE report.
Table 7. Airbnb Market Share
| Period | Airbnb Market Share (Supply) | Airbnb Market Share (Demand) | Airbnb Market Share (Revenue) |
| Jan-15 | 4.74% | 0.06% | 0.07% |
| Feb-15 | 5.64% | 0.50% | 0.46% |
| Mar-15 | 5.43% | 0.65% | 0.58% |
| Apr-15 | 6.42% | 1.52% | 1.30% |
| May-15 | 6.65% | 2.25% | 1.48% |
| Jun-15 | 7.32% | 2.76% | 2.50% |
| Jul-15 | 7.08% | 3.51% | 3.16% |
| Aug-15 | 6.89% | 2.62% | 1.94% |
| Sep-15 | 7.60% | 3.73% | 3.29% |
| Oct-15 | 8.10% | 2.86% | 2.24% |
| Nov-15 | 18.86% | 6.47% | 5.43% |
| Dec-15 | 19.19% | 6.70% | 6.78% |
| Jan-16 | 18.92% | 7.46% | 7.28% |
| Feb-16 | 20.21% | 10.17% | 11.05% |
| Mar-16 | 18.45% | 8.90% | 8.16% |
| Apr-16 | 18.97% | 9.58% | 7.69% |
| May-16 | 18.51% | 9.53% | 7.56% |
| Jun-16 | 19.12% | 9.77% | 8.72% |
| Jul-16 | 18.87% | 9.55% | 8.54% |
| Aug-16 | 18.78% | 8.09% | 6.05% |
| Sep-16 | 19.39% | 7.40% | 5.49% |
While it is still not clear from our analysis whether the increase in overall demand was caused by Airbnb or other economic factors, the descriptive analyses presented in this study suggest that Airbnb does not seem to be competing directly with the hotel industry. However, this was an investigation of the overall hotel market with limited Airbnb data; further analysis is required to determine within-hotel industry effects (e.g. midscale, economy, luxury) and whether Airbnb has a greater impact on asset heavy hotel-REITs or asset-light hotel management and franchising companies (Dogru, 2017a).
Airbnb accommodations may provide substantial financial, economic, and social benefits to the city of Boston if the listings drive additional tourists to the city, which seems to be the case as suggested by our analyses. These benefits include but are not limited to generating additional tax revenues for cities and local governments, especially to neighborhoods not traditionally visited by guests staying within the hotel-dominated areas (Tussyadiah & Pesonen, 2016), and additional income for hosts, which would cause a surge in per capita income. Furthermore, during peak seasons or in the cases of mega-events like the Olympics, the availability of supplementary Airbnb rentals may be more beneficial than building hotels that will later not be utilized at optimal levels (Dogru, 2016, 2017b).
However, the positive economic impacts may not sufficiently compensate for the potential decline in residents’ quality of life. Airbnb could have an adverse impact on the quality of life of local residents in neighborhoods that contain Airbnb offerings because of nuisances and disruptions caused by visitors. Also, the increasing number of Airbnb listings might have undesirable effects on the residential housing market. Homeowners might simply turn their properties into Airbnbs if they believe they can make more money, which may exacerbate preexisting housing problems in metropolitan cities (Lee, 2016). There is little empirical evidence on the economic or social impacts of Airbnb to support either the proponents or the critics of Airbnb. Thus, the course and the magnitude of these impacts do not go beyond speculation for the time being. Moreover, the economic impacts of Airbnb might be better observed once the sharing economy market is regulated. Therefore, further investigations are necessary to measure the economic and social impacts of Airbnb.
Summary of key findings
- Airbnb supply experienced more extraordinary “supply shocks” due to flexibility in adding inventory in Boston. Hotel supply displayed a marginal increase over the analysis period.
- Airbnb experienced greater increases in demand as compared to the increases in the demand for hotel rooms, mirroring the trends in supply growth for the start-up.
- While Airbnb experienced a dramatic increase in occupancy growth throughout the analysis period, these gains did not seem to adversely impact the hotel industry’s occupancy rates, or either hotel ADR and RevPAR growth rates.
- Hotel ADR and RevPAR have continued to grow following the arrival of Airbnb onto the accommodation scene, continuing their pre-Airbnb growth momentum.
- Key performance metrics for Airbnb and hotels indicate a strong positive correlation, suggesting that Airbnb demand is potentially different from hotel demand (i.e., they target different customer segments), and thus, Airbnb’s negative economic impacts on the hotel industry are, at best, marginal.
- Future research should supplement economic analyses with the profiling of customer segments across the hotel industry and Airbnb and should also examine the social impacts of the sharing economy.

Tarik Dogru earned his Ph.D. in Hospitality Management from University of South Carolina, and holds Master’s degree in Business Administration from Zonguldak Karaelmas University in Turkey.Prior to joining the Boston University School of Hospitality Administration faculty, he was an adjunct faculty at University of South Carolina (2013-2016) and research assistant at Ahi Evran University (2009-2012) in Turkey. He has taught a variety of courses, including Economics, Finance, Accounting, Hospitality, and Tourism in business and hospitality schools. He is a Certified Hospitality Educator (CHE) and holds Certification in Hotel Industry Analytics (CHIA) from American Hotel & Lodging Educational Institute. Tarik’s research interests span a wide range of topics in hospitality finance, corporate finance, behavioral finance, real estate investment trusts (REITs), hotel investments, tourism economics, and climate change.

Makarand Mody, Ph.D. has a varied industry background. He has worked with Hyatt Hotels Corporation in Mumbai as a Trainer and as a Quality Analyst with India’s erstwhile premier airline, Kingfisher Airlines. His most recent experience has been in the market research industry, where he worked as a qualitative research specialist with India’s leading provider of market research and insights, IMRB International. Makarand’s research is based on different aspects of marketing and consumer behavior within the hospitality and tourism industries. He is published in leading journals in the field, including the International Journal of Contemporary Hospitality Management, Tourism Management Perspectives, Tourism Analysis and the International Journal of Tourism Anthropology. His work involves the extensive use of inter and cross-disciplinary perspectives to understand hospitality and tourism phenomena. Makarand also serves as reviewer for several leading journals in the field. In fall 2015, he joined the faculty at the Boston University School of Hospitality Administration (SHA). He received his Ph.D. in Hospitality Management from Purdue University, and also holds a Master’s degree from the University of Strathclyde in Scotland.

Courtney Raeisinafchi, Ph.D spent 6 years designing and developing hotels and restaurants with Jordan Mozer and Associates, Ltd., an architecture firm based in Chicago, IL, after completing a bachelors degree at the School of the Art Institute of Chicago where she studied architecture. Some notable projects she was involved in includes Marriott’s Renaissance Hotel, Times Square and Hotel 57 in Manhattan, NY; both hotels have received the International Hotel , Motel and Restaurant Society’s Golden Key Awards for Best hotel design. While drafting new proposals for hospitality projects for Jordan Mozer and Associates in Southeast Asia, she began a masters degree, studying hospitality administration, at the University of Nevada, Las Vegas (UNLV) in Singapore. After graduating, she continued to complete her doctoral degree in Hospitality Administration at UNLV in Las Vegas and studied towards a second masters degree in architecture at UNLV’s School of Architecture. Courtney joined the Boston University School of Hospitality Administration in 2013. She teaches the Design and Development Class as well as Lodging Operations and Technology. She is an active quantitative researcher on the topics of hospitality development and built environments, as well as design and atmospherics impacts on consumer behavior.
References
-
CBRE. (2017). Hosts with Multiple Units – A Key Driver of Airbnb Growth. Retrieved from https://www.ahla.com/sites/default/files/CBRE_AirbnbStudy_2017.pdf
-
Choi, K. H., Jung, J. H., Ryu, S. Y., Do Kim, S., & Yoon, S. M. (2015). The relationship between airbnb and the hotel revenue: In the case of Korea. . Indian Journal of Science and Technology, 8(26), 1-8. doi:10.17485/ijst/2015/v8i26/81013
-
Dogru, T. (2016). Development of the Hotel Industry in China: Mega-Events, Opportunities, and Challenges. E-review of Tourism Research, 13.
-
Dogru, T. (2017a). C-corporation Hotels vs. Hotel-REITs: A Theoretical and Practical Comparison. Boston Hospitality Review, 5(1).
-
Dogru, T. (2017b). Under- vs. over-investment: Hotel firms’ value around acquisitions. International Journal of Contemporary Hospitality Management, 29(8).
-
Haywood, J., Mayock, P., Freitag, J., Owoo, K. A., & Fiorilla, B. (2017). Airbnb & Hotel Performance: An analysis of proprietary data in 13 global markets. Retrieved from http://www.str.com/Media/Default/Research/STR_AirbnbHotelPerformance.pdf
-
Intelligence, B. (Producer). (2017). Airbnb CEO speaks on disrupting hotel industry. Retrieved from http://www.businessinsider.com/airbnb-ceo-speaks-on-disrupting-hotel-industry-2017-3
-
Lee, D. (2016). How Airbnb Short-Term Rentals Exacerbate Los Angeles’s Affordable Housing Crisis: Analysis and Policy Recommendations. Harvard Law and Policy Review, 10, 229-253.
-
Mody, M., Suess, C., & Lehto, X. (in press). The Accommodation Experiencescape: A Comparative Assessment of Hotels and Airbnb. International Journal of Contemporary Hospitality Management.
-
Tussyadiah, I. P., & Pesonen, J. (2016). Impacts of peer-to-peer accommodation use on travel patterns. Journal of Travel Research, 55(8), 1022-1040.
-
Yurieff, K. (2017). Airbnb raises $1 billion in funding. CNN. Retrieved from http://money.cnn.com/2017/03/09/technology/airbnb-billion-funding/index.html?iid=ob_homepage_tech_pool
-
Zervas, G., Proserpio, D., & Byers, J. W. (2016). The Rise of the Sharing Economy: Estimating the Impact of Airbnb on the Hotel Industry. Journal of Marketing Research(ja), null. doi:10.1509/jmr.15.0204 %U http://journals.ama.org/doi/abs/10.1509/jmr.15.0204
4 comments
Really impressive article.
Thank you very much for sharing a very informative article as you have explained everything with easy examples keep up the good work. Also, Visit:- Magento 2 Bundle Option Image Extension
Your exploration of how Airbnb has woven itself into the cultural fabric of Boston was enlightening. From the historic neighborhoods to the bustling downtown, it’s fascinating to see how short-term rentals are reshaping the way visitors experience the city. https://www.trippybug.com/10-best-restaurants-in-boston-seaport/
In this article, we are dedicated to providing you with the most comprehensive and up-to-date information regarding Baskin Robbins’ menu prices.
Baskin Robbins Menu Prices